

In this post:
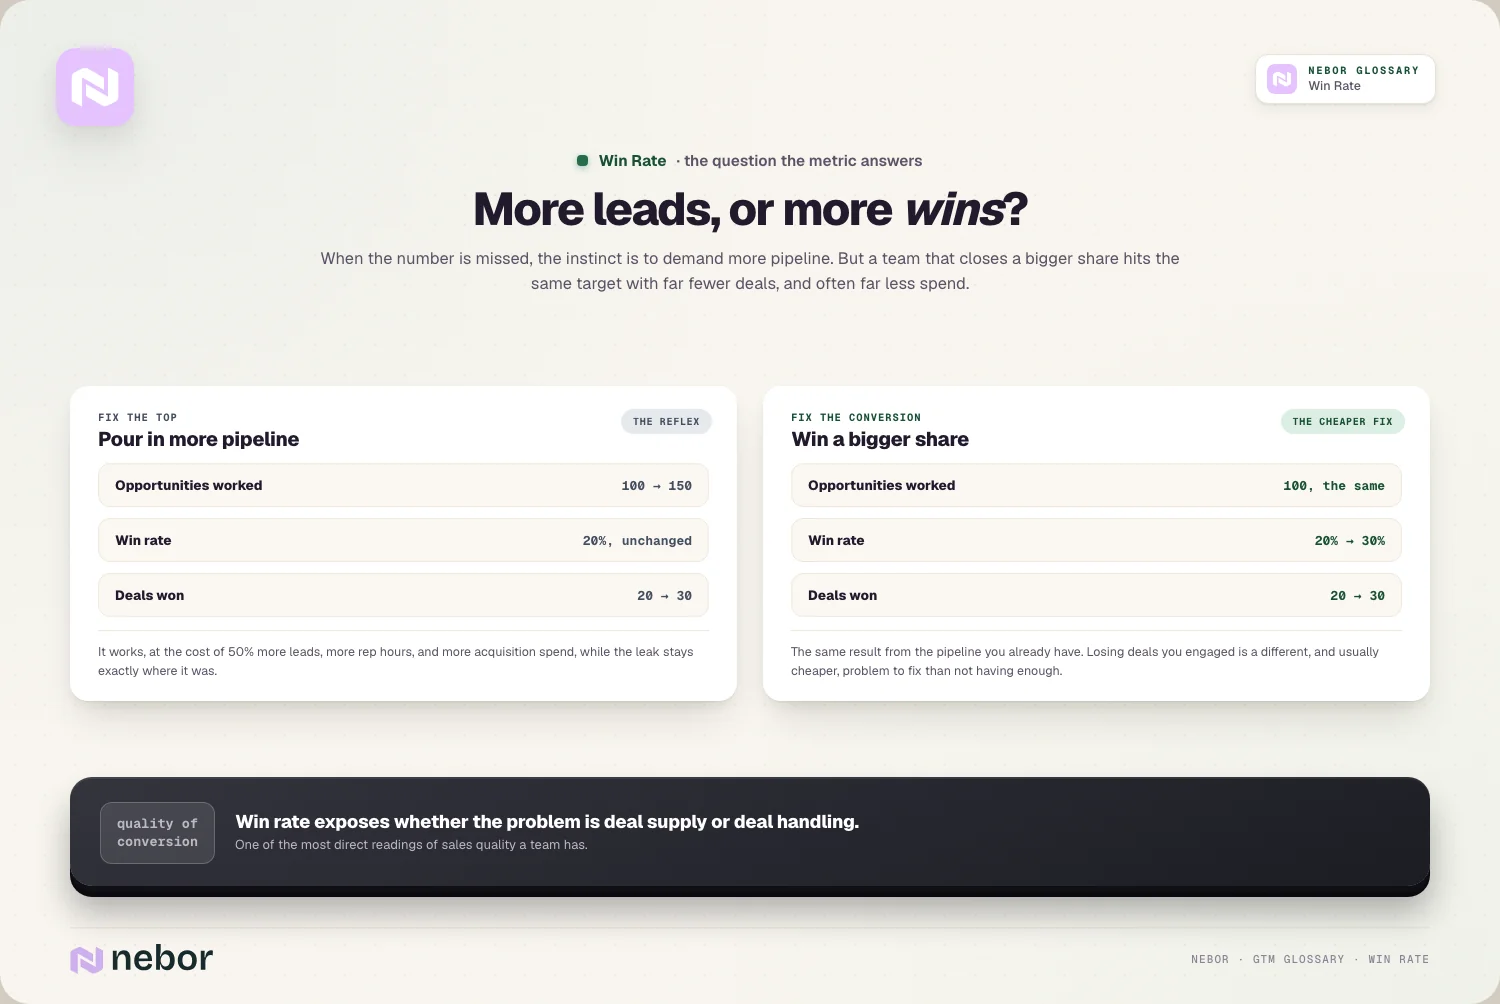
When a team misses its number, the instinct is usually to demand more leads. But often the problem isn't the top of the funnel at all, it's what happens to the deals already in it.
A team that closes a bigger share of its opportunities hits the same target with far less pipeline.
Win rate is the metric that exposes that. It measures what share of your real opportunities end up closing, so it tells you whether your problem is a shortage of deals or a weakness in converting the ones you have.
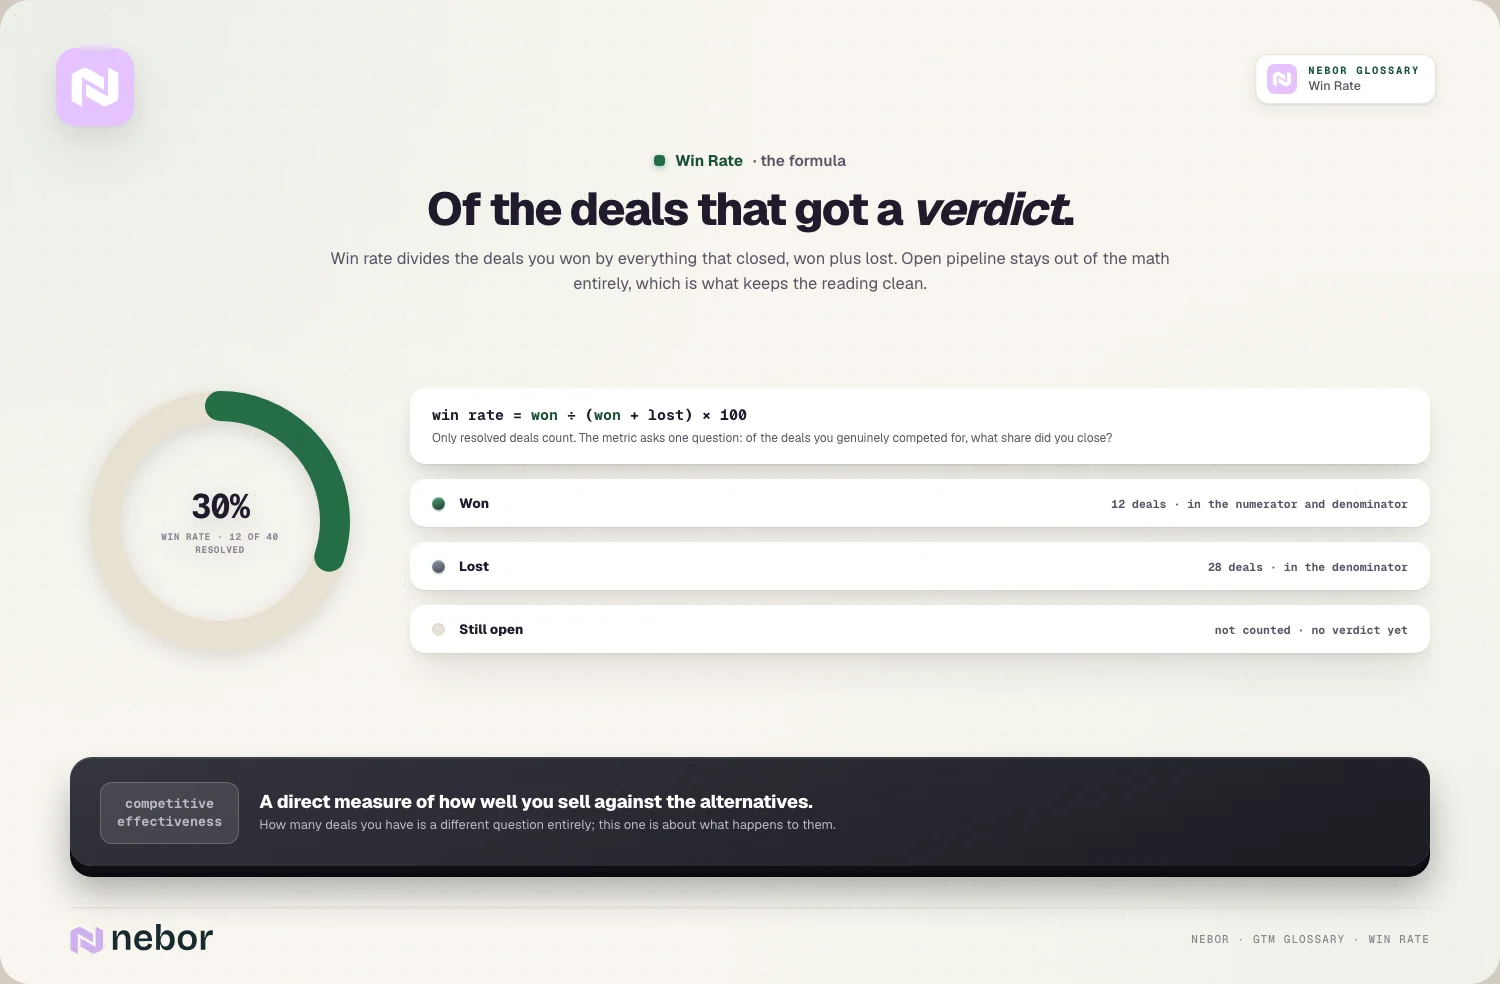
Win rate is the percentage of deals you win out of those that reached a final outcome, calculated as won deals divided by the total of won plus lost. It measures your competitive effectiveness at turning opportunities into customers.
The metric carries weight as one of the most direct readings of sales quality you have. A low win rate means you're losing deals you engaged, which is a different and often cheaper problem to fix than simply not having enough of them.
TL;DR
Win rate is the share of your closed deals that you won, calculated as won deals divided by won plus lost, showing how effectively you convert opportunities.
It reveals sales quality, because a low win rate means you're losing deals you already have, which points to a different fix than just generating more pipeline.
The average B2B win rate is lower than most expect, around 21% across all opportunities, and it varies sharply by deal size and segment.
The biggest lever is qualification, because most losses happen before real selling even begins, so working better-fit deals lifts win rate more than any closing tactic.
What win rate measures precisely and how you calculate it cleanly
Win rate measures how often you win the deals that reach a decision. It's a clean read on your effectiveness at closing the opportunities you actively pursue.
The formula is simple to write down. You divide the deals you won by the total that closed, meaning won plus lost, then multiply by a hundred to get a percentage.
It counts only the deals that reached a resolution. Because it looks at won versus lost, win rate focuses on opportunities that reached a clear verdict instead of ones still open in your pipeline.
It reflects how effectively you compete for real deals. A win rate tells you, of the deals you competed for in earnest, what share you closed, a direct measure of how well you sell against the alternatives.
So win rate is a focused measure of closing effectiveness. It isolates how good you are at winning the deals you engage, a very different thing from how many deals you have in the first place.
How win rate differs from your overall pipeline close rate exactly
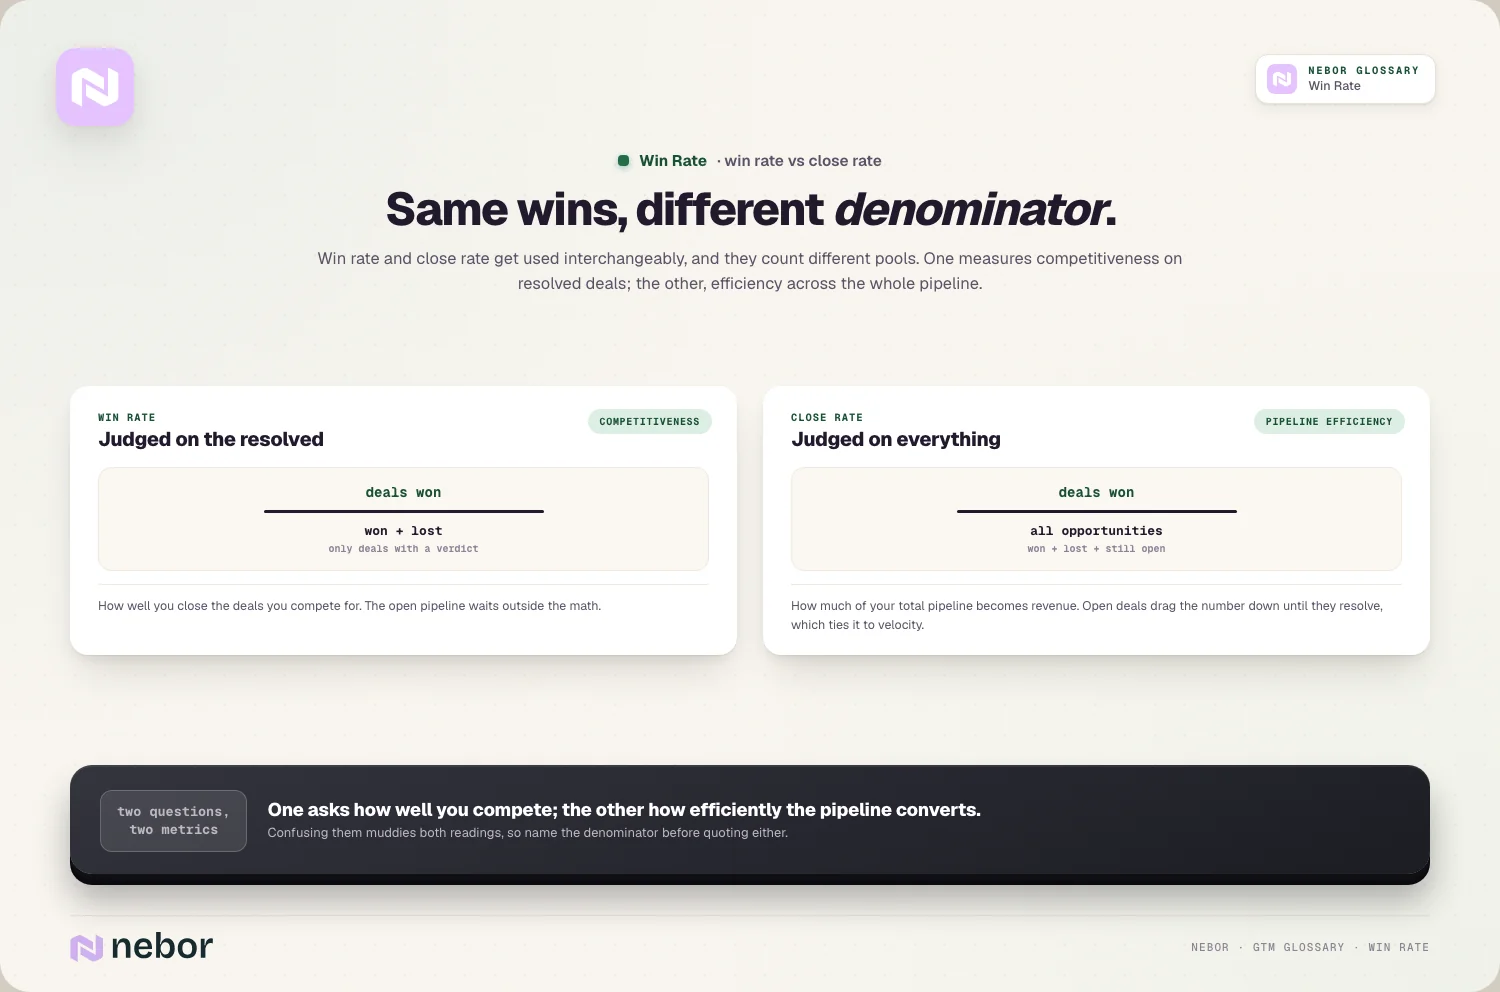
Win rate is often confused with close rate, and the distinction matters for what each tells you. The two metrics build on entirely different denominators.
Win rate uses only the resolved deals. It divides wins by won plus lost, so it measures effectiveness on the deals that reached an outcome either way.
Close rate uses every opportunity you opened. It divides wins by every opportunity including still-open ones, so it reflects overall pipeline efficiency and velocity instead of pure competitiveness.
The two answer different questions about your funnel. Win rate asks how well you close the deals you compete for, while close rate asks how much of your total pipeline turns into revenue.
So win rate and close rate are related but distinct. One measures your competitive strength on live deals, the other measures how efficiently your whole pipeline converts, and confusing them muddies both.
Why deciding how to count no-decision deals changes everything
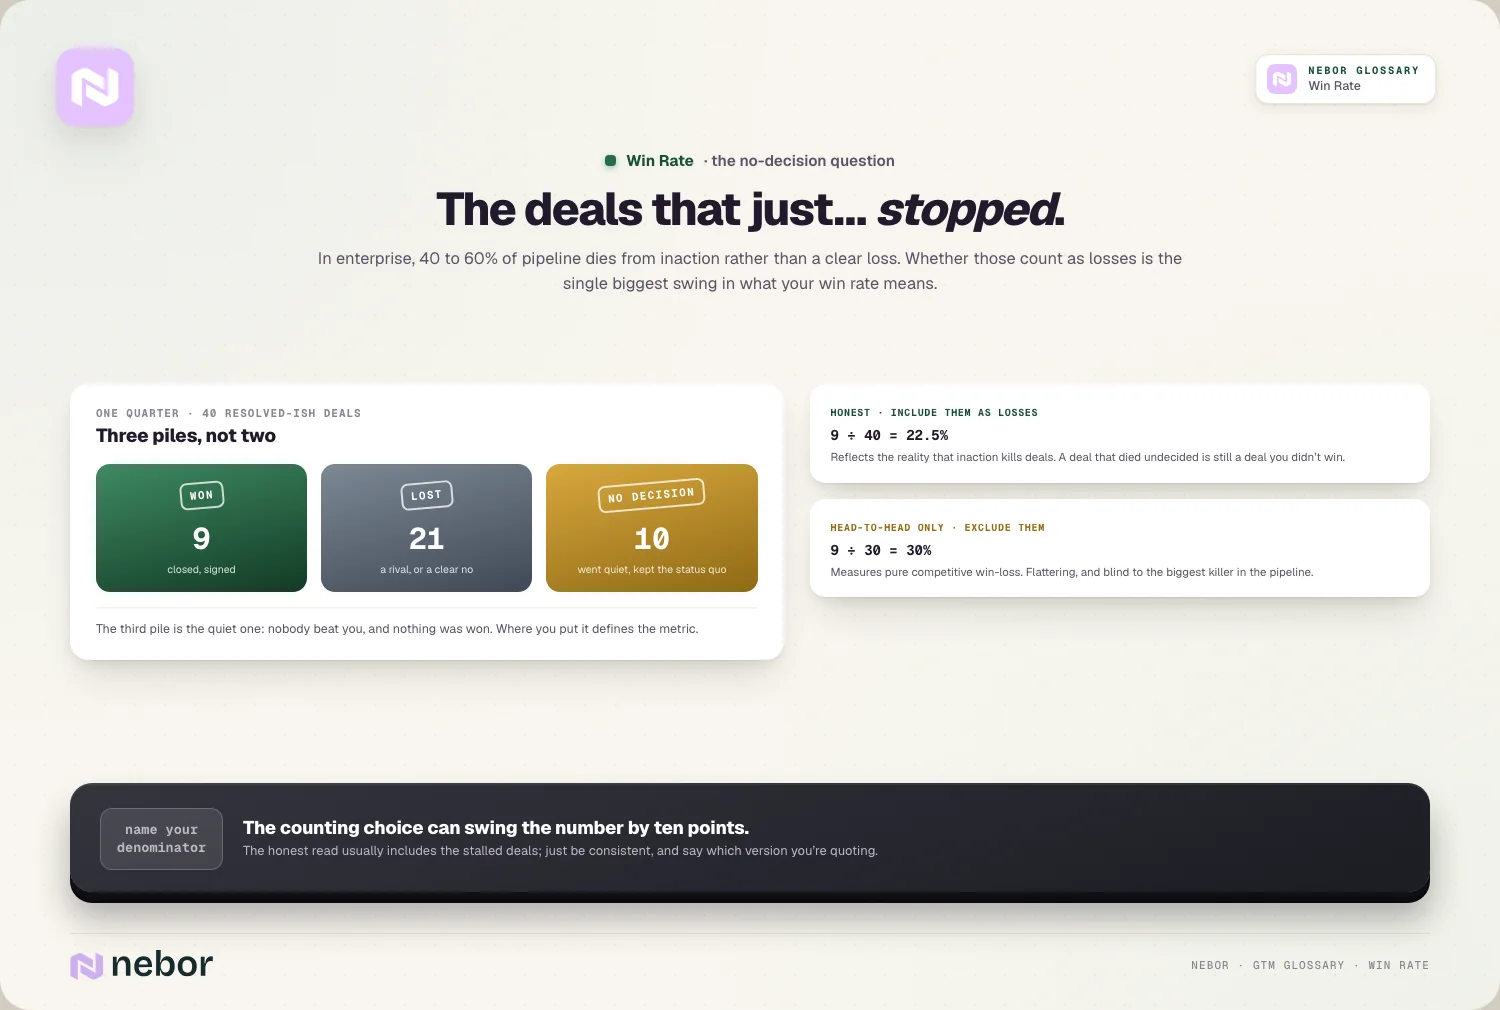
The single biggest variable in win rate is how you treat deals that simply die without a verdict. That choice can swing the number dramatically.
No-decision deals are more common than losses. A large share of pipeline, especially in enterprise, dies from inaction instead of a clear loss, with 40 to 60% of enterprise pipeline ending in no decision.
Including them gives you a more realistic number. Counting stalled deals as losses produces a conservative win rate that reflects the reality that inaction kills many deals.
Excluding them measures only the head-to-head battles. Ignoring no-decision deals shows only your competitive win-loss record, which flatters the number but hides deals lost to indecision.
So how you count no-decision deals defines what your win rate really means. The honest approach usually includes them, because a deal that dies from inaction is still, in the end, a deal you didn't win.
What a good win rate looks like across B2B sales teams in practice
Benchmarks help you judge your number, though they vary widely, so context is essential. The averages are lower than many expect.
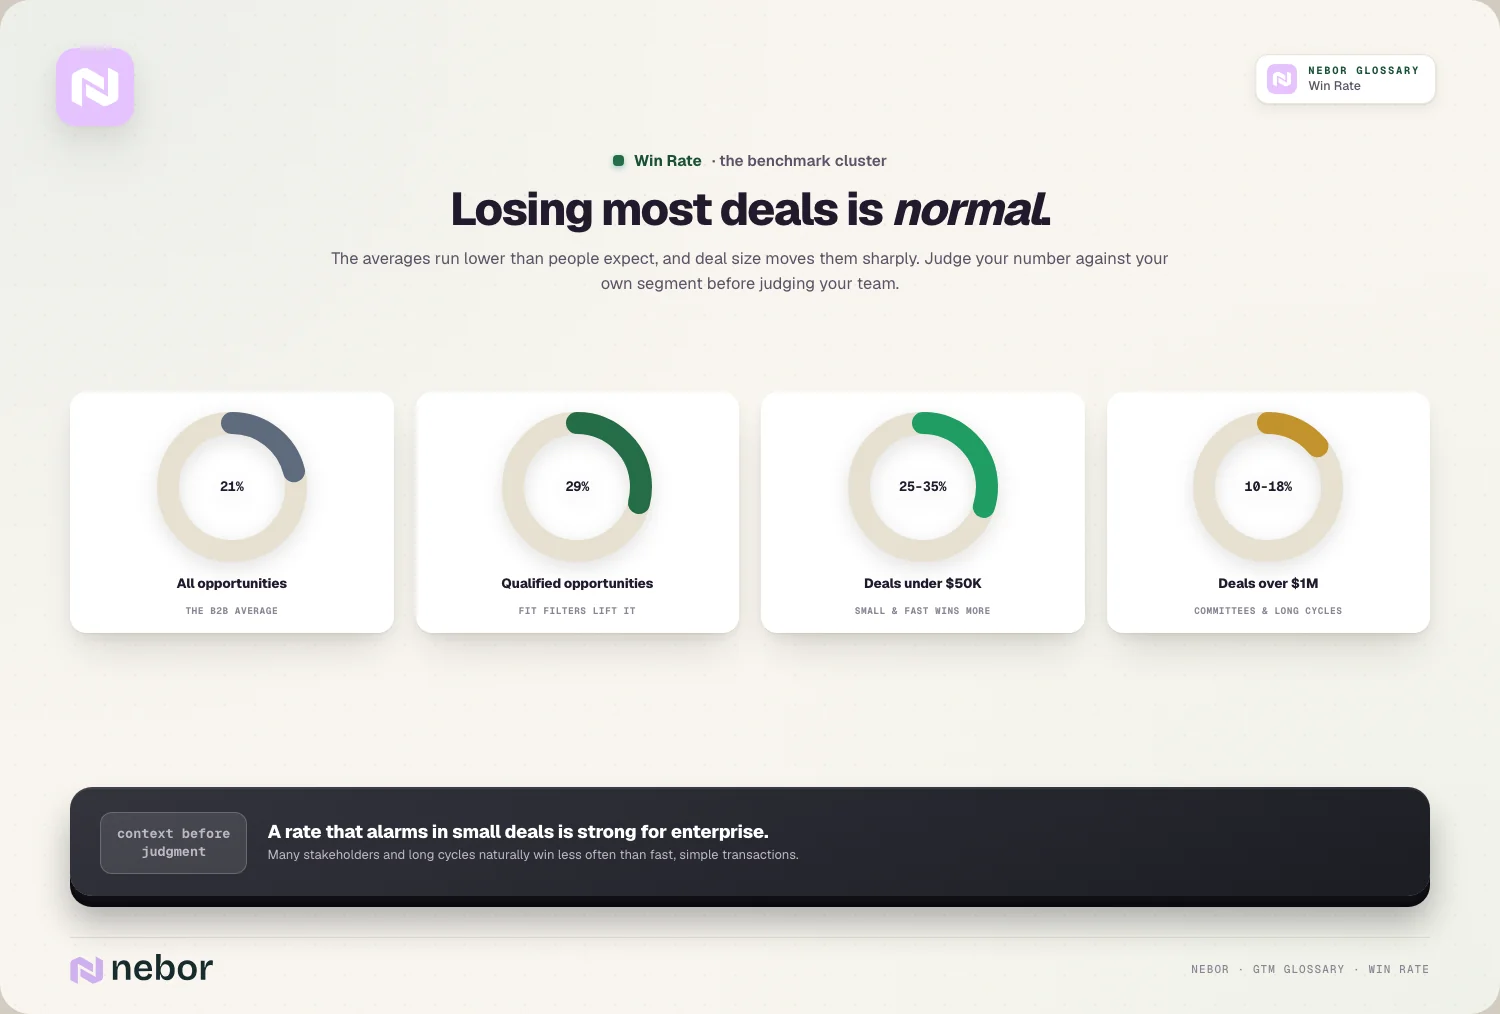
The average across B2B sales is a modest one. The typical B2B team wins around 21% of all opportunities and 29% of qualified ones, so losing most deals is normal rather than a sign of failure.
Deal size shifts the benchmark more than anything else. Smaller deals win more often, with under $50K closing at 25 to 35%, while deals over a million dollars land closer to 10 to 18%.
The segment you sell into matters too. Enterprise deals with many stakeholders and long cycles naturally win at lower rates than fast, simple transactions, so a healthy win rate depends on what you sell.
So judge your win rate against your own deal size and segment first. A rate that's alarming for small deals can be strong for large enterprise ones, and that spread is exactly why the raw number means little without context.
Why most deals are lost long before the real selling ever begins
The most useful insight about win rate is where deals get lost, and in our experience it's earlier than almost anyone assumes. Most losses happen before the real sales work.
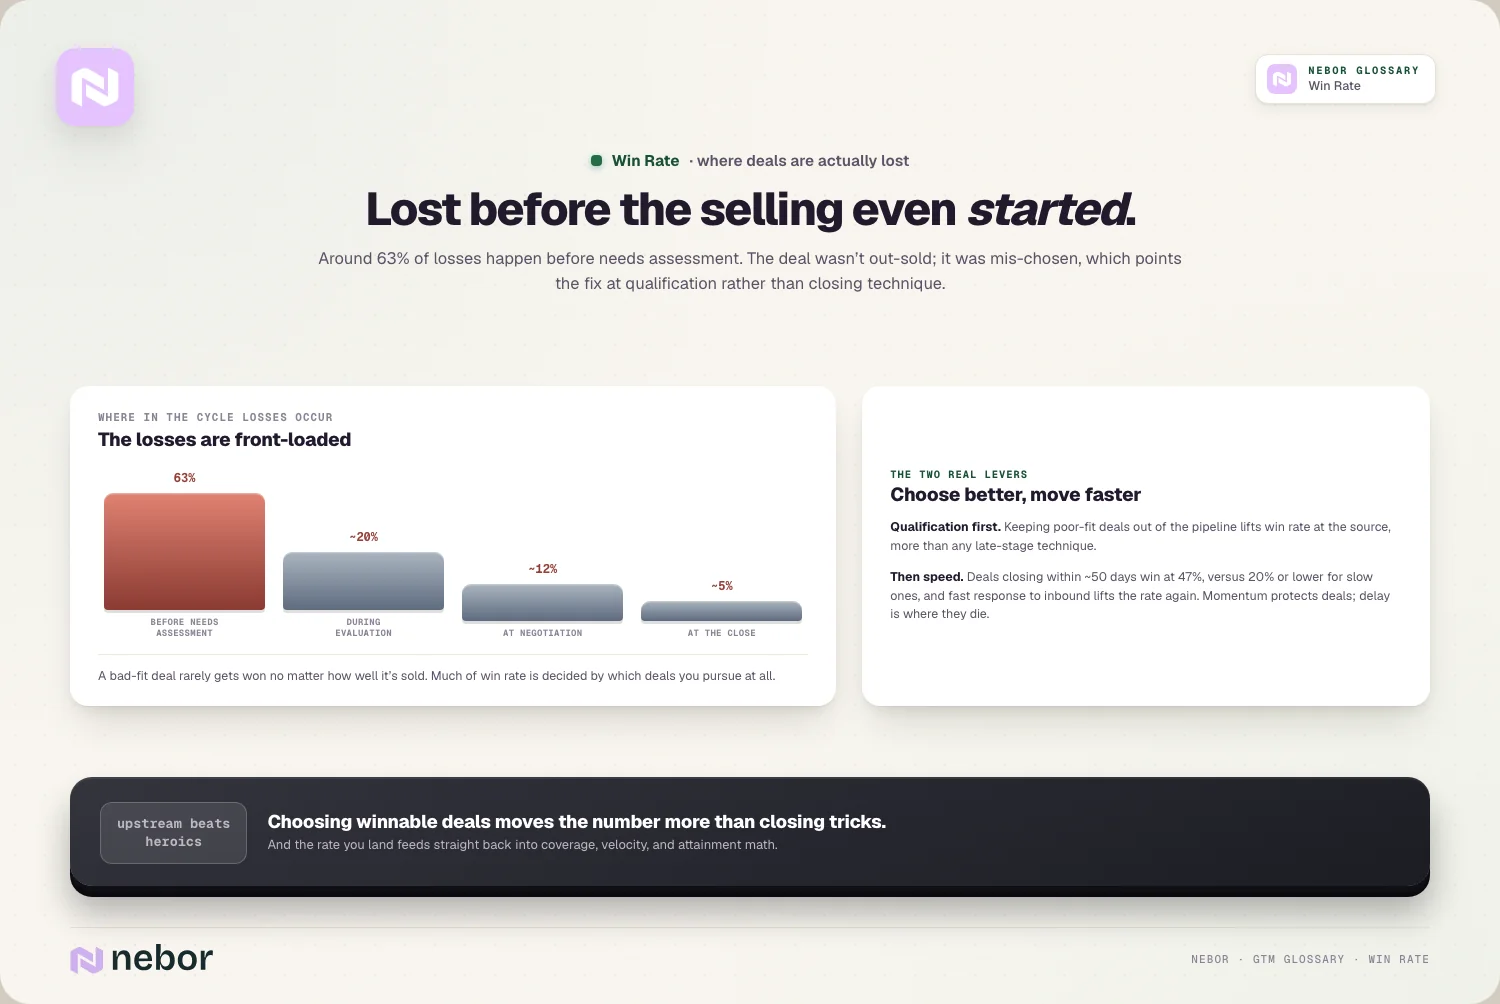
The losses trace back to early decisions. Around 63% of losses happen before needs assessment, meaning the deal was effectively lost before serious selling ever started.
Poor fit is the culprit in most of them. A deal that was never a good match rarely gets won no matter how well you sell it, so much of win rate is decided by which deals you pursue.
This reframes the problem of a low win rate entirely. If most losses come from bad-fit deals, then improving win rate is less about closing technique and more about choosing better opportunities upfront.
So win rate is largely set before the pitch. The deals you choose to work determine much of whether you win, which points to qualification as the real lever instead of closing skill.
How better qualification lifts win rate more than any closing tactic
Since most losses trace to bad-fit deals, qualification becomes the highest-return way to raise win rate. Working the right deals beats working harder on the wrong ones.
Qualification filters the doomed deals out early. Strong lead qualification keeps poor-fit opportunities out of your active pipeline, so your reps spend time only on deals that can plausibly be won.
Fit is the foundation everything else rests on. Pursuing accounts that match your ideal customer profile means the deals you work are winnable, which lifts win rate at the source.
It beats closing tricks by a wide margin. No amount of skilled closing rescues a fundamentally bad-fit deal, so choosing better deals moves win rate far more than improving late-stage tactics.
So the biggest win-rate lever is upstream. Qualifying harder and targeting better-fit accounts raises the share you win more reliably than any technique applied once a deal is already underway.
Why both speed and deal velocity tend to drive your win rate higher
Beyond fit, how fast you move affects how often you win. Both response speed and deal velocity correlate strongly with win rate.
A fast response wins measurably more deals. Reaching inbound interest quickly, the core of speed to lead, correlates with materially higher win rates, while waiting a day can cut them sharply.
Deals that keep moving close at visibly higher rates. Opportunities that close within about 50 days win at 47%, versus 20% or lower for slower ones, a striking difference that also shows up in your pipeline velocity.
Momentum protects deals from dying of neglect. A deal that keeps moving is less likely to stall or die, so compressing the sales cycle directly protects the win rate.
So speed works as a win-rate lever on top of an efficiency one. Reaching prospects fast and keeping deals moving both raise the share you win, because delay is where deals cool and die.
How win rate feeds directly into all of your wider pipeline math
Win rate goes past being a scorecard, feeding into how much pipeline you need in the first place. It shapes the revenue math for your whole team.
It sets how much coverage you need. Your win rate determines how much pipeline coverage you need, because a lower rate means you must carry more pipeline to hit the same target.
It feeds your pipeline velocity as a direct input. Win rate is one of the four inputs to sales velocity, so improving it directly speeds how fast your pipeline turns into revenue.
It shapes whether reps hit their quotas. A higher win rate makes hitting quota easier, so it flows straight through to quota attainment across the team.
So win rate ripples through your entire pipeline math. Raising it lets you hit the same number with less pipeline, making it one of the most efficient levers to improve.
How win rate relates to the conversion rate through your funnel
Win rate and funnel conversion sound similar, so it helps to place them together. One is a stage, the other spans the whole journey.
Win rate measures the final stage alone. It measures conversion at the point where a live deal is won or lost, so it's the last and most competitive step of the funnel.
Conversion rate covers more of the funnel. The broader conversion rate tracks how leads move through every stage, of which the win-loss step is only the final one.
Weak earlier stages hide inside it too. A poor win rate can trace back to bad leads entering the funnel, so the earlier conversion steps shape what your win rate can even be.
So win rate is the last link in a longer conversion chain. Reading it alongside the earlier stages shows whether your closing is weak or whether the problem started much further upstream.
How handling objections well protects your win rate on live deals
While most losses trace to fit, the deals you do compete for are still won or lost on execution. Objection handling is a big part of that.
Unresolved concerns kill deals that were winnable. A live deal often stalls on a doubt the rep never surfaced or addressed, so weak objection handling quietly drags win rate down.
Handling them well saves deals you would have lost. Working through a prospect's real concerns keeps a good-fit deal moving toward a yes instead of letting it drift to no decision.
It compounds with fit rather than replacing it. Strong execution on well-chosen deals is where win rate peaks, because good fit gets the deal in play and good handling closes it.
So execution still matters on the deals you fight. Once fit gets a deal into real competition, how well you handle objections is what decides whether it becomes a win.
Why win rate is such a useful diagnostic when you segment it
A single win-rate number is useful, but we tell clients that breaking it down is where it turns diagnostic. Segmentation reveals exactly where you win and lose.
Broken out by rep, it shows who needs coaching. Comparing win rates across reps reveals who's converting well and who needs help, which makes coaching targeted instead of generic.
Broken out by source, it shows lead quality. Win rates by lead source show which channels produce winnable deals, so you can invest in the ones that convert to revenue.
By stage, it shows where deals die. Seeing where in the process deals are lost points at the specific stage to fix, whether that's early qualification or late negotiation.
So a segmented win rate is a map of your sales effectiveness. Breaking the number down by rep, source, and stage turns a single figure into a precise guide to what to improve.
The common mistakes teams make when they read their win rate
Win rate gets misread in a few predictable ways, and we keep seeing the same ones when teams share their dashboards with us. Avoiding them is what keeps the number honest.
The biggest is counting the denominator inconsistently. Changing whether no-decision deals count as losses makes win rates incomparable over time, so you need one consistent definition.
Another is comparing rates across unlike segments. Judging an enterprise win rate against an SMB benchmark makes a normal number look broken, because deal size shifts the baseline so much.
A third is blaming closing skill for fit problems. Treating a low win rate as a closing problem misses that most losses come from bad-fit deals chosen too early.
The last is watching only the blended number. A single company-wide win rate hides the rep, source, and stage differences that would tell you what to fix.
Why win rate is really a measure of the deals you choose to fight
The deepest way to understand win rate is that it reflects your choices as much as your selling. Which deals you pursue shapes the number more than how you close.
It rewards discipline about which deals to chase. Working fewer, better-fit deals raises win rate, so the willingness to walk away from poor-fit opportunities is itself a win-rate strategy.
It punishes the instinct to chase everything. Pursuing every deal regardless of fit drags win rate down, because you fill your pipeline with opportunities you were never going to close.
It compounds with the rest of your funnel. A strong win rate makes coverage, velocity, and attainment all easier, so improving it lifts the whole revenue engine at once.
Treating win rate as a signal of which deals to fight, and improving it through sharper choices, is one of the highest-return moves in a modern go-to-market system.
It turns the pipeline you automate sales prospecting to build into revenue far more efficiently than chasing volume alone.
Deel dit bericht
RevOps
Begrippenlijst
Gerelateerde begrippen
De basis GTM-concepten begrijpen




Klaar om je pipeline te bouwen