

In this post:
A sales team can have a pipeline that looks stuffed full and still miss its number every quarter. The deals are there, the dashboard looks healthy, and yet revenue keeps arriving late and short.
The usual reason is that they're measuring how much pipeline they have instead of how fast it moves. A big pile of slow, stuck deals generates less revenue than a smaller pile that closes quickly.
Pipeline velocity is the metric that captures that speed. It measures how fast qualified opportunities move through your pipeline and turn into revenue, expressed as dollars per day.
That framing is what makes it powerful. Instead of one more vanity count, pipeline velocity tells you how much money your pipeline actually produces over time, which is the number that pays the bills.
TL;DR
Pipeline velocity measures how quickly opportunities move through your pipeline into revenue, calculated as the number of opportunities times average deal size times win rate, divided by the sales cycle length in days.
Its value is that it turns four separate metrics into one number showing revenue per day, making it both a forecast and a diagnostic, because you can see exactly which lever is dragging.
You improve it by pulling one of four levers, more qualified opportunities, bigger deals, higher win rates, or shorter cycles. Each one raises the speed at which your pipeline produces money.
One warning belongs up front, because the levers interact and chasing one carelessly can hurt another. Stuffing your pipeline with weak deals, for instance, often lowers win rate and lengthens cycles, so velocity barely moves.
What is pipeline velocity, and what does the number really tell you?
Pipeline velocity is a single number that answers a simple question. How much revenue does your pipeline generate per day at its current efficiency?
It combines four things that usually get tracked separately. The number of open opportunities, the average deal size, the win rate, and how long deals take to close.
When you put them together, you stop looking at isolated stats and start seeing how they combine into actual revenue speed. A change in any one of them moves the final number.
That's why it's more useful than any of its parts alone. A high win rate means little if deals take a year to close, and fast cycles mean little if you're winning tiny deals, but velocity captures the whole picture.
The output is intuitive once you see it. A velocity of two thousand dollars per day means your pipeline, as it stands right now, produces about that much revenue every single day.
How do you calculate pipeline velocity with the four-part formula?
The formula looks more intimidating than it is. You multiply three things, then divide by one.
Take your number of qualified opportunities, multiply by your average deal size, then multiply by your win rate as a decimal. Divide that result by your average sales cycle length in days.
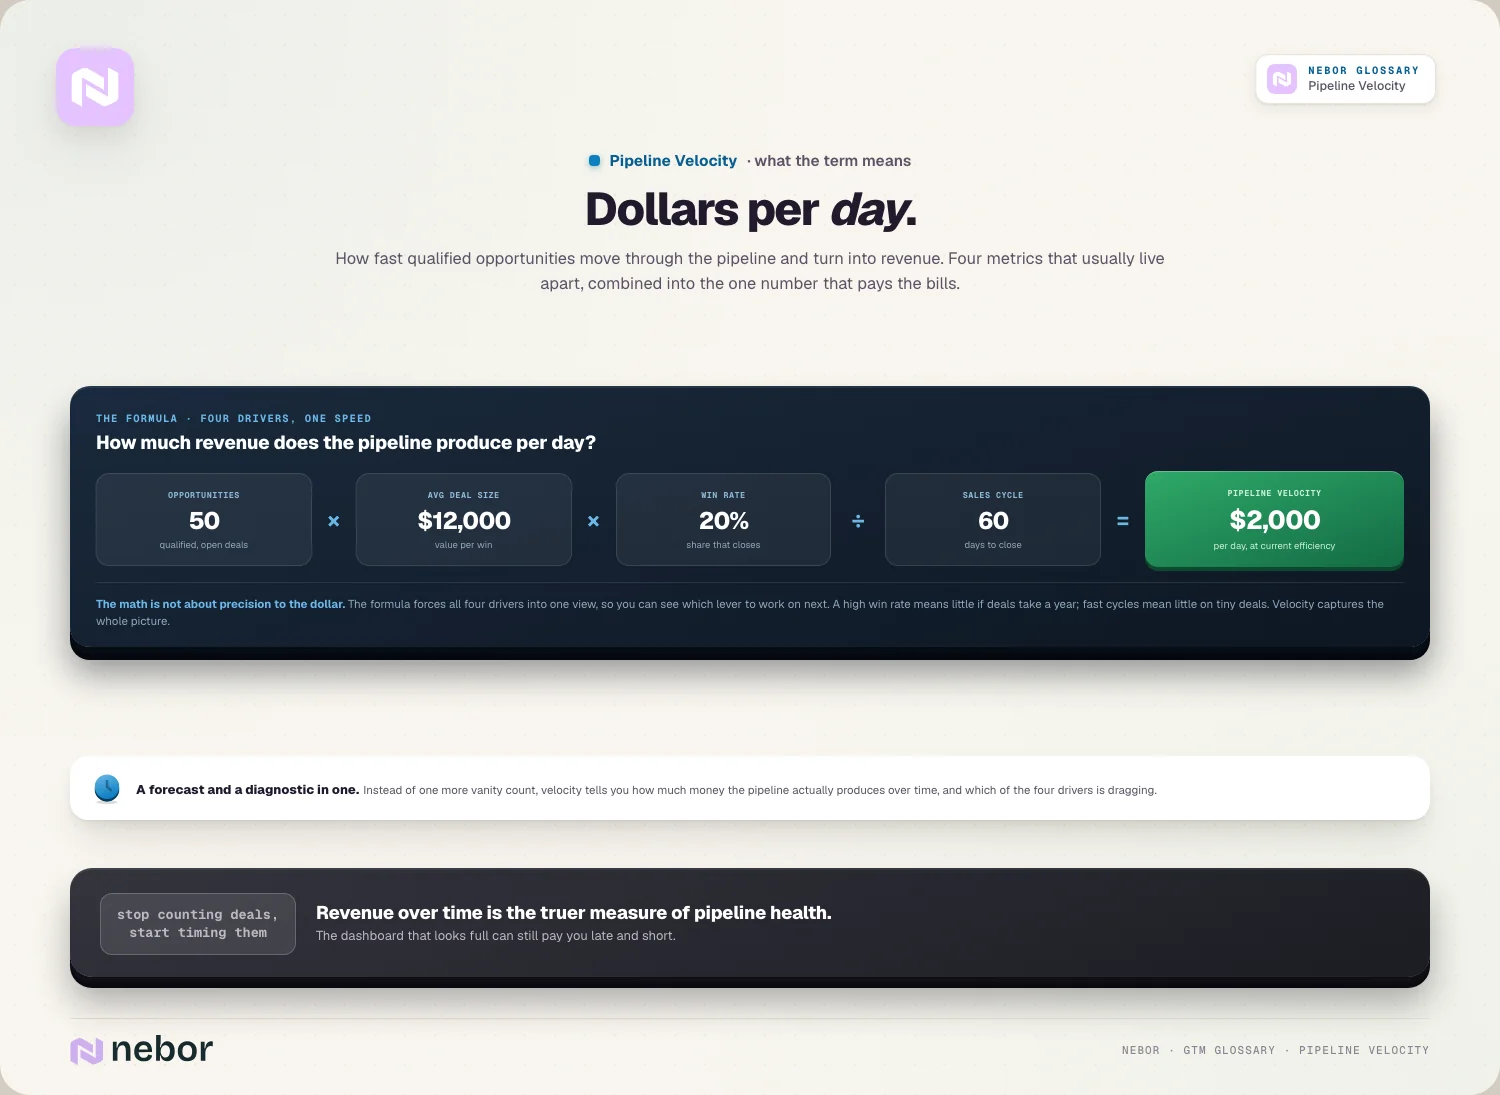
A quick example makes the formula concrete. Say you have 50 opportunities, an average deal size of $12,000, and a 20% win rate, which gives you $120,000 of expected revenue.
Now divide by a 60-day sales cycle, and you get $2,000 per day. That single number is your pipeline velocity, and it's the figure you want to push upward over time.
The point of the math isn't precision to the dollar. It's that the formula forces all four drivers into one view, so you can see which one to work on next.
Why is pipeline velocity better than just measuring pipeline volume?
This is the distinction that trips teams up the most. Pipeline volume and pipeline velocity sound similar, but they tell you very different things.
Volume is how much is in the pipeline, the total value of open deals. It feels reassuring when it's big, and that reassurance is exactly what makes teams over-trust it.
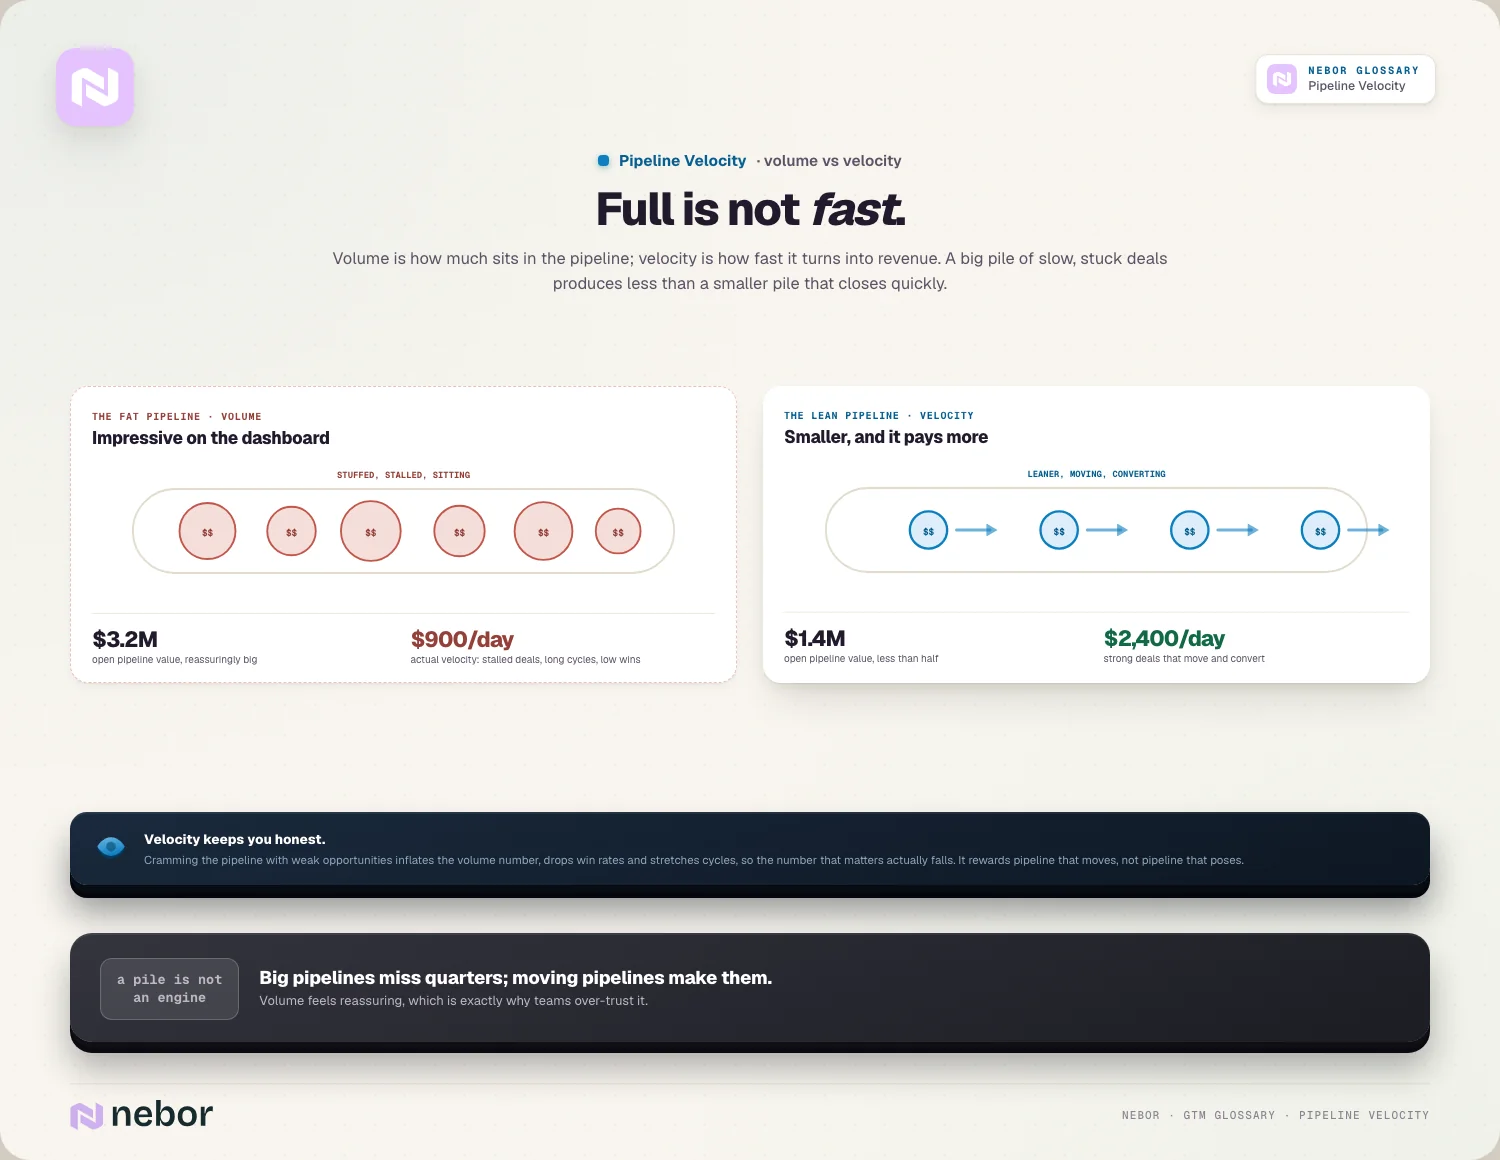
Velocity is how fast that pipeline turns into revenue instead. A huge pipeline full of stalled, poorly-fit deals can have terrible velocity, while a leaner one of strong deals can have excellent velocity.
Chasing volume for its own sake is where this goes wrong. Cramming the pipeline with weak opportunities inflates the volume number but often drops win rates and stretches cycles, so velocity ends up falling.
So velocity keeps you honest, because it rewards pipeline that moves and converts rather than pipeline that just stalls there looking impressive on a board, and that makes it a far better measure of real health than volume.
What do the four velocity levers look like when you work them in practice?
The beauty of the formula is that it hands you exactly four ways to grow revenue. Every improvement to pipeline velocity comes from moving one of these levers.
More qualified opportunities is the most familiar lever, because adding good-fit deals to the top raises velocity, as long as they're qualified and hold up under scrutiny later.
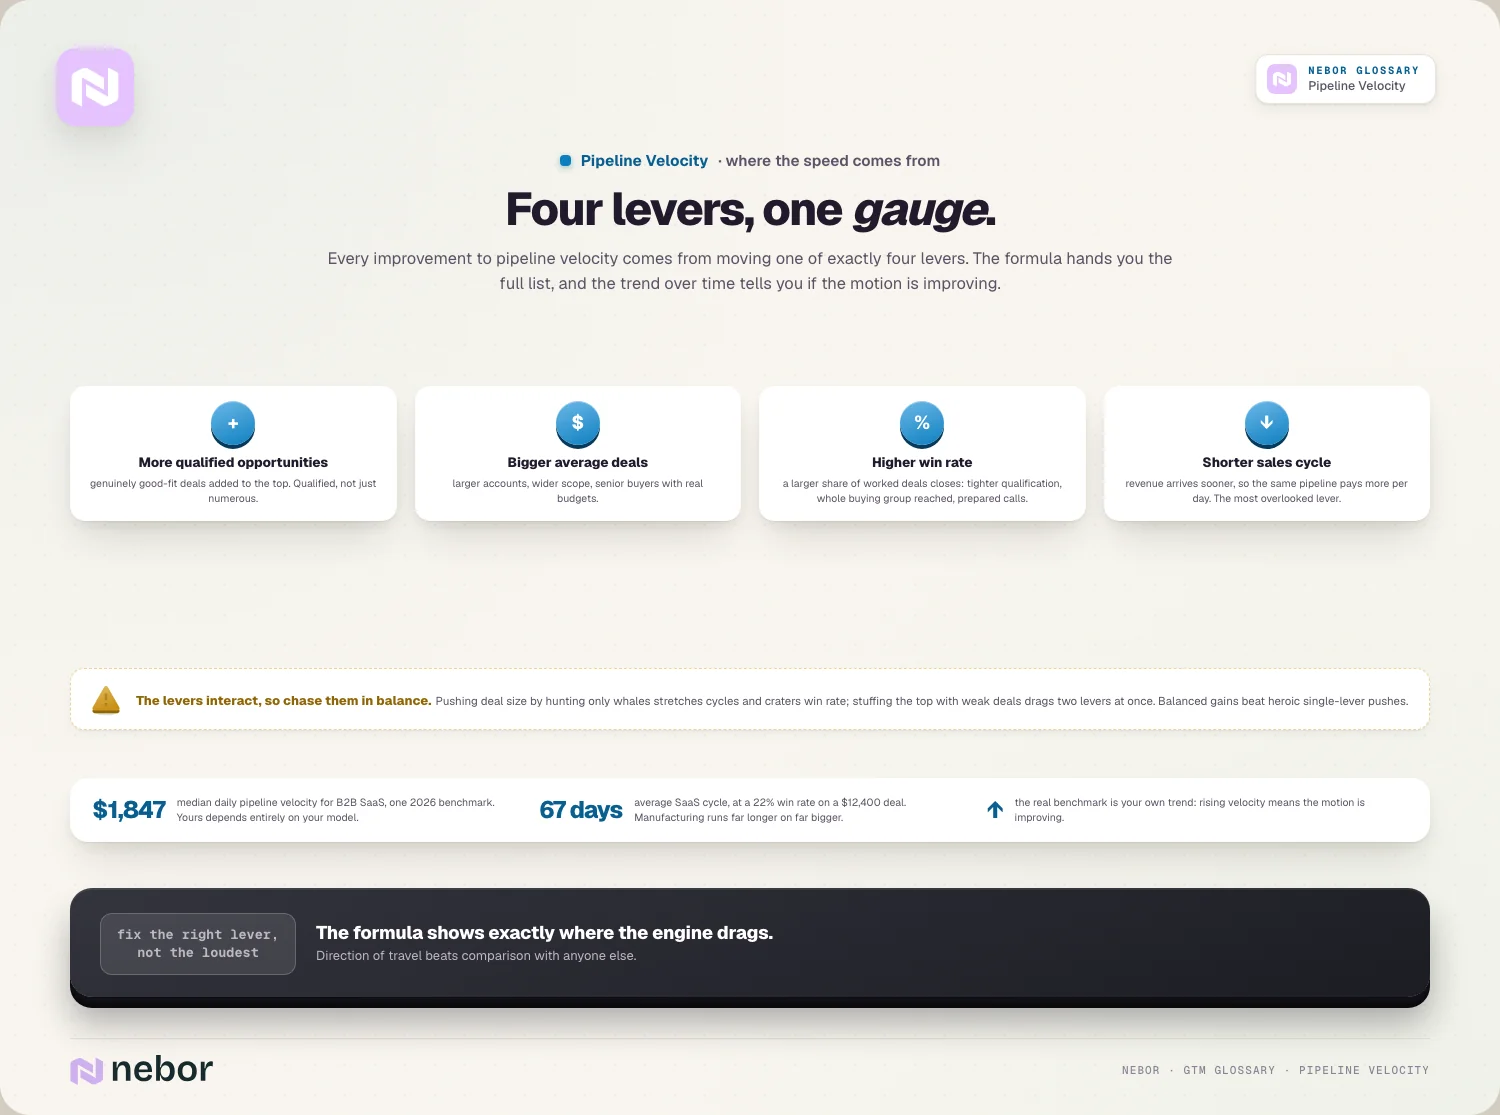
Bigger average deal size is the second lever, where selling larger deals, moving upmarket, or expanding what each customer buys lifts the value flowing through at the same speed.
A higher win rate is the lever that rewards better selling, because closing a larger share of the deals you work means more of your pipeline converts, which raises velocity without needing any extra volume.
And a shorter sales cycle is the one teams overlook, because when deals close faster, revenue arrives sooner, and the same pipeline produces more dollars per day.
How does your targeting end up driving every one of the levers at once?
Here's the insight most velocity advice misses. The four levers aren't independent, and the single biggest input that moves several of them together is who you sell to.
It starts with your ideal customer profile. Selling to well-fit accounts tends to raise win rates, increase deal sizes, and shorten cycles all at once, because the right buyers see the value faster.
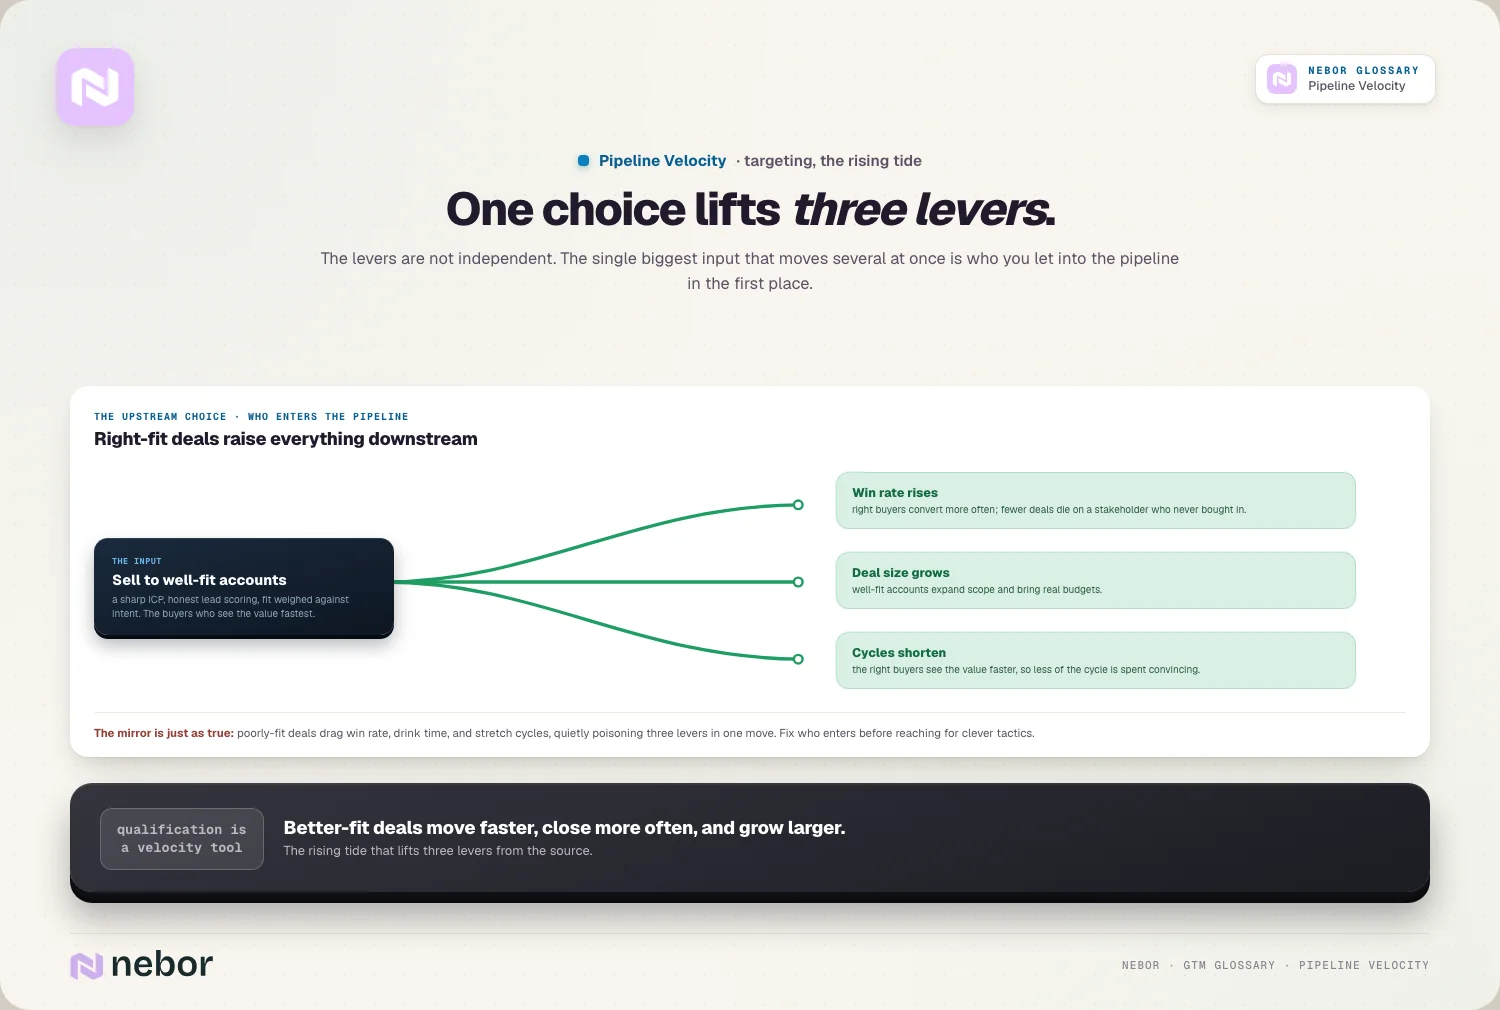
The opposite is just as true, because chasing poorly-fit deals drags down win rate, drinks up rep time, and stretches cycles, so weak targeting damages three levers in one move. We watch this play out in client pipelines more often than any other velocity problem.
This is why qualification matters so much for velocity. Tools like lead scoring and a clear fit score versus intent score keep your pipeline full of deals that genuinely move.
So before you try clever tactics, fix who enters the pipeline. Better-fit deals are the rising tide that lifts opportunities, deal size, win rate, and cycle time together.
How do you shorten your sales cycle without cutting corners to get there?
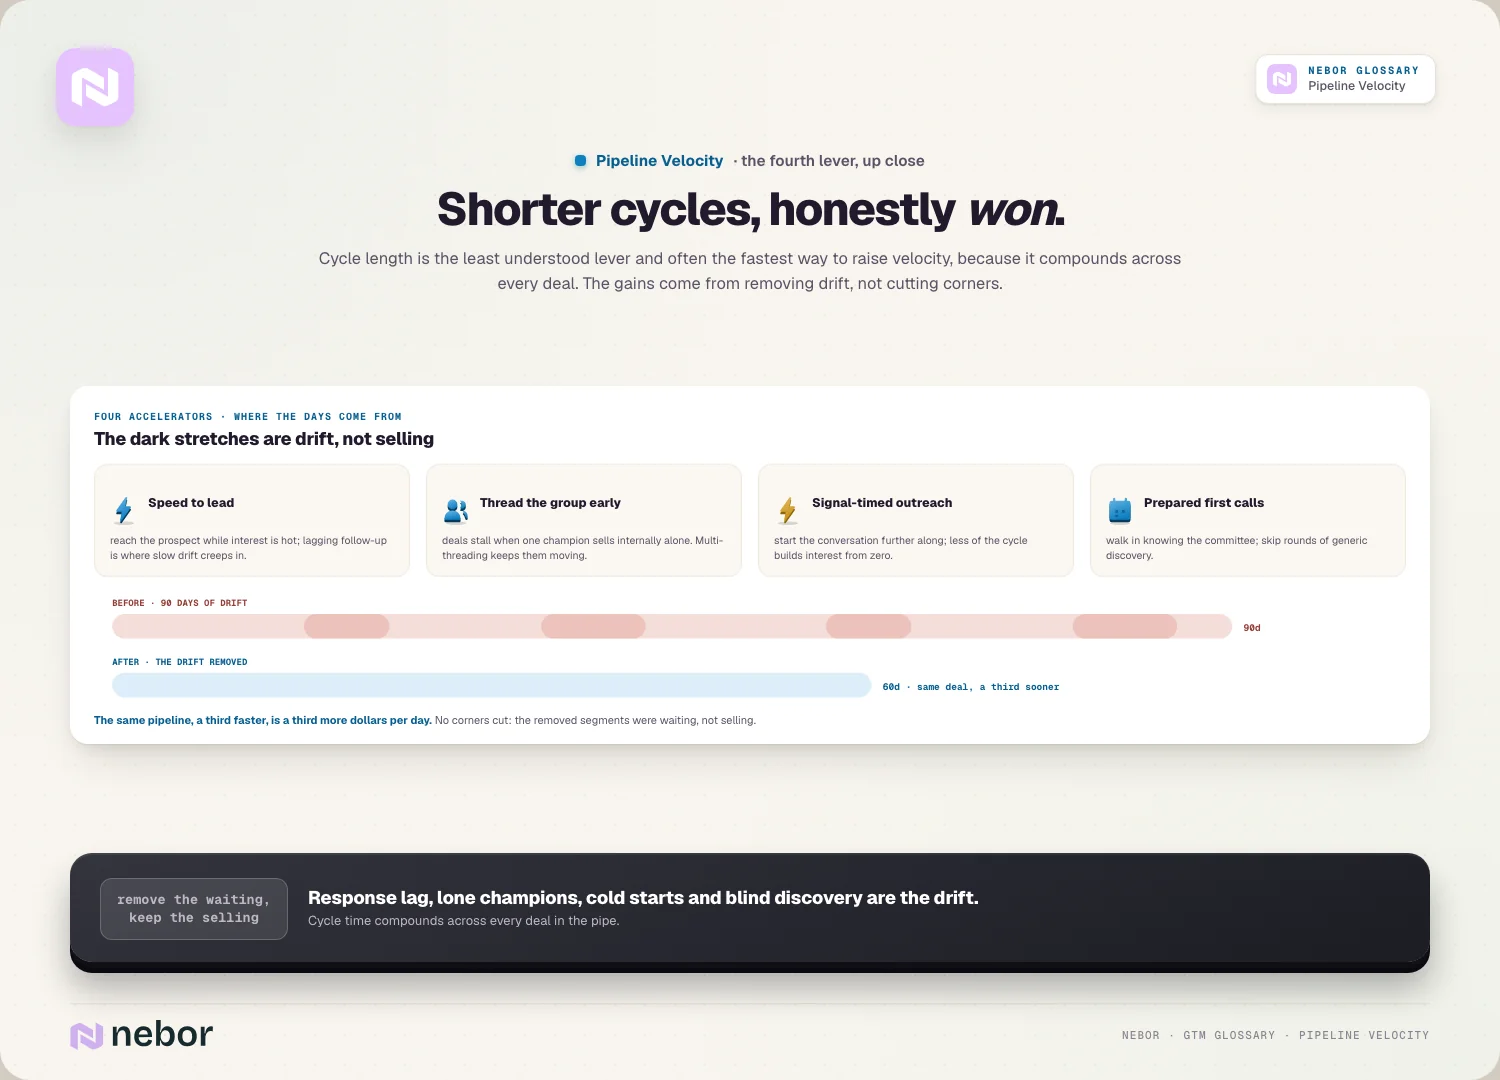
Cycle length is the lever teams understand least, and in our experience shortening it is often the fastest way to raise velocity, because the gain compounds across every deal.
A huge driver is speed of response. Reaching a prospect while their interest is hot, the heart of speed to lead, removes the slow drift that creeps into deals when follow-up lags.
Another is reaching the whole buying group early. Deals stall when one champion has to sell internally alone, so multi-threading across stakeholders keeps things moving.
Warm context speeds things up as well, because when outreach is timed to real buying signals, the conversation starts further along, so less of the cycle goes to building interest from zero.
And preparation matters at the meeting stage. Walking into a first call already knowing the buying committee, the way a good inbound meeting workflow sets up, cuts out rounds of discovery and shortens the whole path.
What do realistic pipeline velocity benchmarks look like out there?
Benchmarks help you sanity-check your number, though they vary widely by industry and deal size, so they work better as rough guides than as targets.
The inputs swing enormously from one business to the next. SaaS win rates typically fall between 5% and 20%, and sales cycles stretch from around 14 days for tiny deals to nine months for large enterprise ones.
Industry shapes the number heavily on top of that. SaaS and tech average around a 67-day cycle with a 22% win rate on a $12,400 deal, while manufacturing has much longer cycles on far bigger deals.
For a concrete reference point, one 2026 benchmark puts the median daily pipeline velocity for B2B SaaS companies at around $1,847 per day. Your own number depends entirely on your model.
The real value of benchmarks is direction instead of comparison. What matters most is whether your own velocity is rising over time, because that trend tells you your motion is improving.
How does pipeline velocity connect to the rest of your go-to-market?
Pipeline velocity works as a readout of how well your whole go-to-market motion works, because almost everything upstream shows up in it eventually.
Your top-of-funnel work feeds the opportunity count. A strong multi-channel outreach motion and steady demand keep qualified deals flowing in, which supports the first lever directly.
Your warm motions affect cycle length and win rate. An inbound-led outbound approach brings in warmer deals that close faster and convert better than purely cold ones.
Automation keeps the whole thing efficient. The same systems that automate sales prospecting free reps to spend time on the deals that move, which lifts velocity across the board.
So velocity becomes a scoreboard for the system. When you build a connected go-to-market system, pipeline velocity is one of the clearest signals that the machine is doing its job.
How do you raise your win rate and deal size alongside the speed?
Cycle time gets the attention, but the other two levers, win rate and deal size, often hold the most room to grow, and they reward better selling as much as faster selling.
Win rate climbs when you work the right deals well. Tighter qualification keeps weak deals out, and reaching the full buying group means fewer deals die because one stakeholder never bought in.
Preparation moves it just as reliably as qualification does. Reps who walk into calls already understanding the account's situation and pain win more often than those doing generic discovery, because they feel relevant from the first minute.
Deal size grows in a few honest ways. Selling to larger accounts, expanding the scope of what you solve, and reaching senior buyers who own bigger budgets all lift the average value moving through.
The caution is to grow these without wrecking the others. Pushing for huge deals can stretch cycles and lower win rates, so the goal is balanced gains, where a bigger deal still closes at a healthy rate and pace.
How often should you check pipeline velocity, and how should you read it?
Pipeline velocity is most useful as a trend instead of a one-time snapshot, because watching how it moves over time tells you far more than any single reading.
A sensible rhythm is to calculate it monthly or each quarter, using a consistent window so the numbers stay comparable. The direction of travel is the signal you care about most.
Segmenting it pays off too, because velocity by source, by segment, or by rep reveals where the engine moves fast and where it drags, which a single blended number hides completely.
The point of checking regularly is to catch shifts early. A slowly lengthening cycle or a dipping win rate shows up in velocity before it shows up in a missed quarter, giving you time to react.
The data has to be clean for any of this to work. Velocity built on a messy CRM produces confident nonsense, so keeping stages and deal values honest is part of measuring it at all.
What are the common mistakes teams make with pipeline velocity?
Even teams that track velocity manage to misread or misuse it, and we keep seeing the same few mistakes in the pipelines we audit.
Optimizing volume at the expense of velocity tops the list, because adding weak deals to look busy inflates the pipeline but lowers win rate and lengthens cycles, so the number you care about drops.
Ignoring data quality is a close second, because velocity is only as honest as your CRM, and messy stages, stale deals, and missing values produce a confident number that means nothing.
Treating the four levers as separate is the subtler slip, because pushing deal size by chasing only huge enterprise accounts, for example, can crater win rate and stretch cycles, leaving velocity flat.
And forgetting what happens after the close rounds things out, because faster pipeline matters far more when customers stick and grow, and velocity reads best alongside net revenue retention.
Why is pipeline velocity a forecast just as much as it is a metric?
One underrated use of pipeline velocity is prediction. Because it expresses revenue per day, it gives you a grounded, real-time read on what your pipeline will produce.
If your velocity holds steady at a known dollar-per-day rate, you can project forward with far more confidence than a gut-feel forecast, because the number is built from how your pipeline behaves in reality.
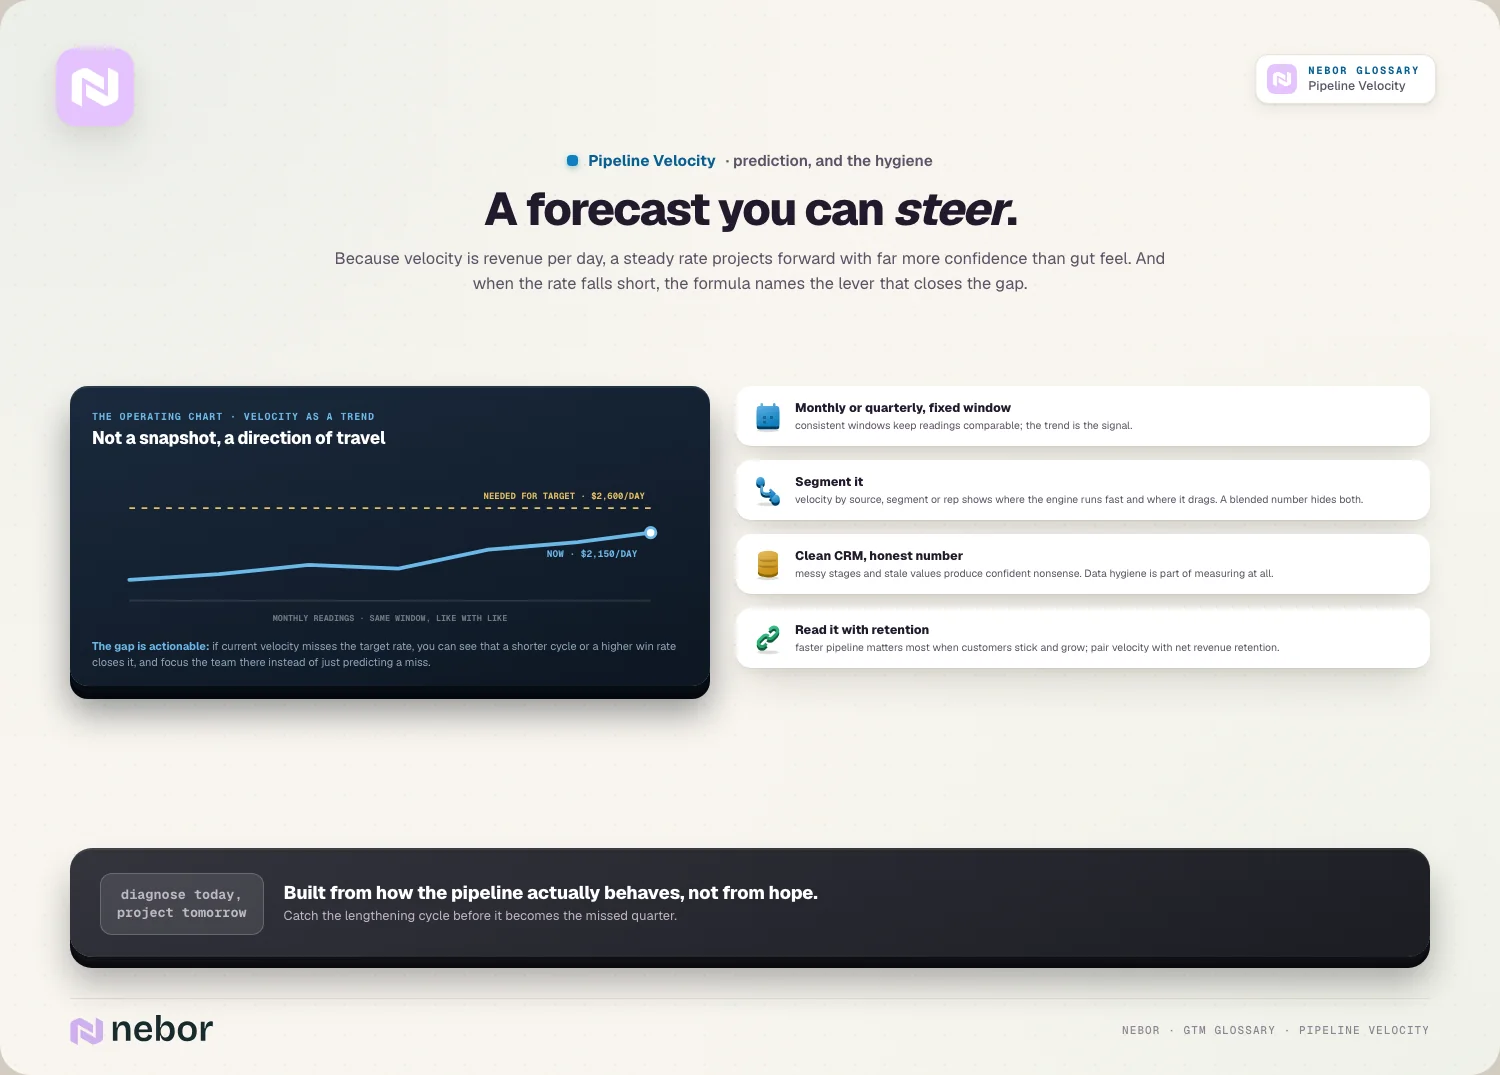
It makes planning concrete in the same stroke, because if you know the velocity you need to hit a target and your current rate falls short, the formula tells you which lever to move and by how much.
That turns forecasting into something you can act on, because instead of just predicting a miss, you can see that a shorter cycle or a higher win rate would close the gap, and focus the team there.
So velocity does double duty for you. It diagnoses where revenue is slow today and projects where it lands tomorrow, and that dual role is what earns it a place as a core operating number.
Why timing your deals beats counting them when revenue feels stuck
Pipeline velocity matters because it measures the thing that pays you, which is revenue over time rather than deals piling up. It cuts through a fat-looking pipeline to ask whether that pipeline is really moving.
Its real gift is the focus it forces, because by combining four drivers into one number, it shows you exactly where your revenue engine is slow, so you can fix the right lever instead of guessing.
The deeper lesson is that most of those levers trace back to one choice, which is who you let into the pipeline. Better-fit deals move faster, close more often, and grow larger, lifting velocity from the source.
So if your pipeline looks full but revenue feels stuck, stop counting deals and start timing them. The speed at which your pipeline turns into money is the truer measure of health, and pipeline velocity is how you finally see it.
Share this post
RevOps
Glossary
Related glossary items
Understanding the core GTM concepts




Ready to build your pipeline