

In this post:
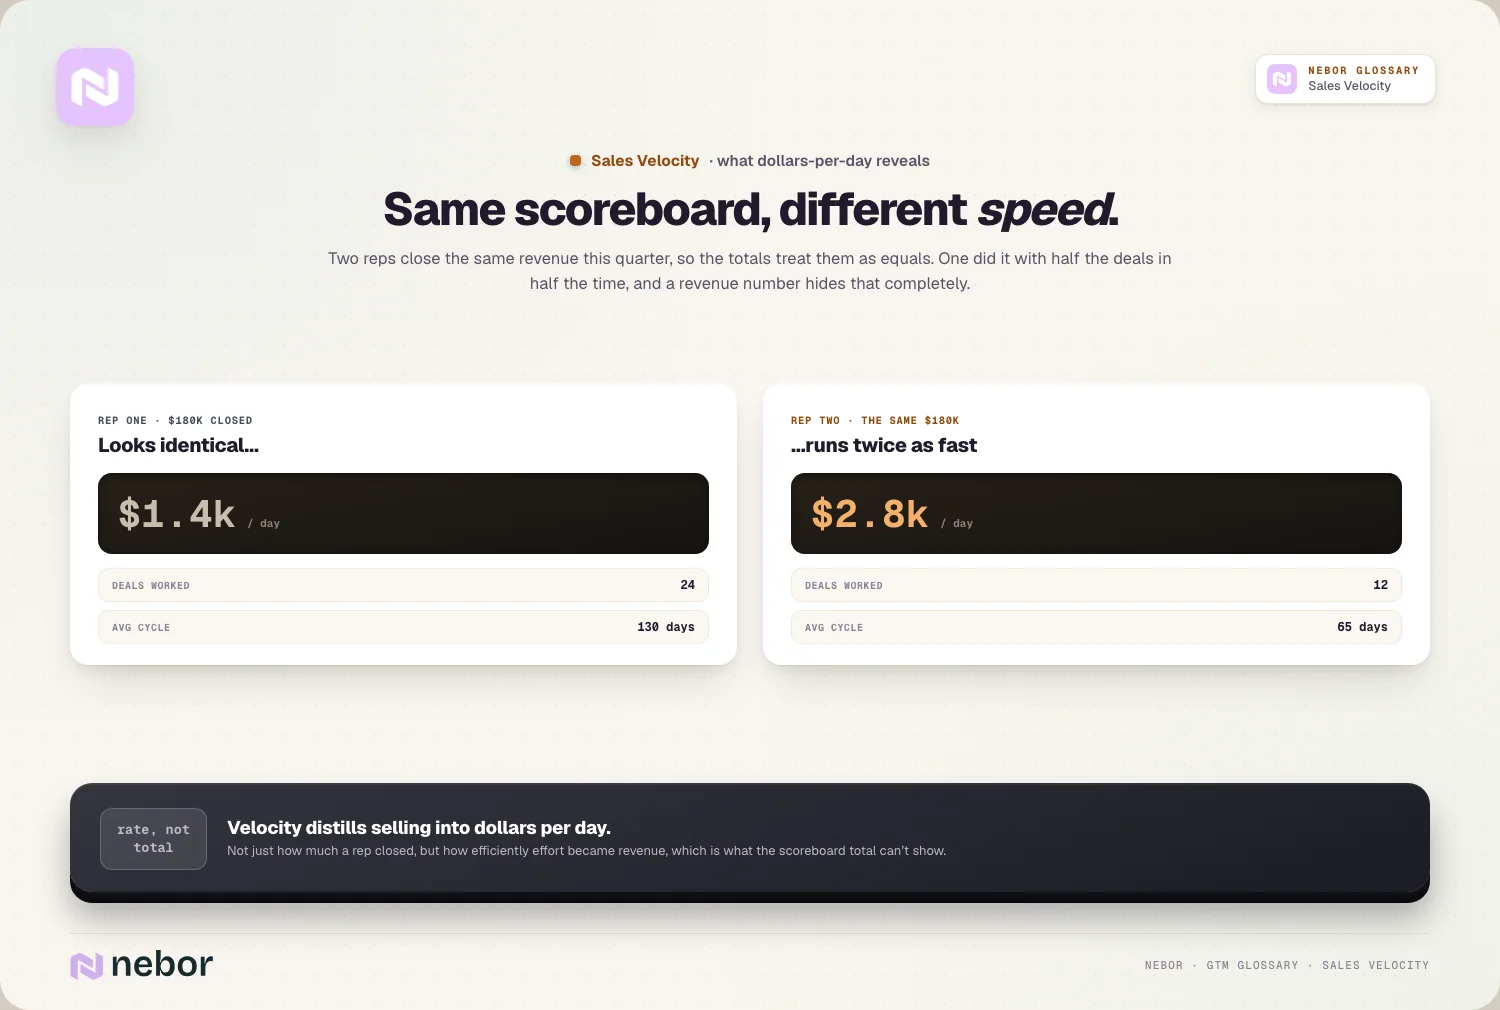
Two reps close the same amount of revenue this quarter. On the scoreboard they look identical, so as the manager you treat them the same. But one did it with half the deals in half the time, which makes them far more productive, and a simple revenue total hides that completely.
Sales velocity is the number that tells them apart. It distills selling into a single dollars-per-day figure built from four inputs, so you can see not just how much a rep or team closed, but how efficiently they turned effort into revenue.
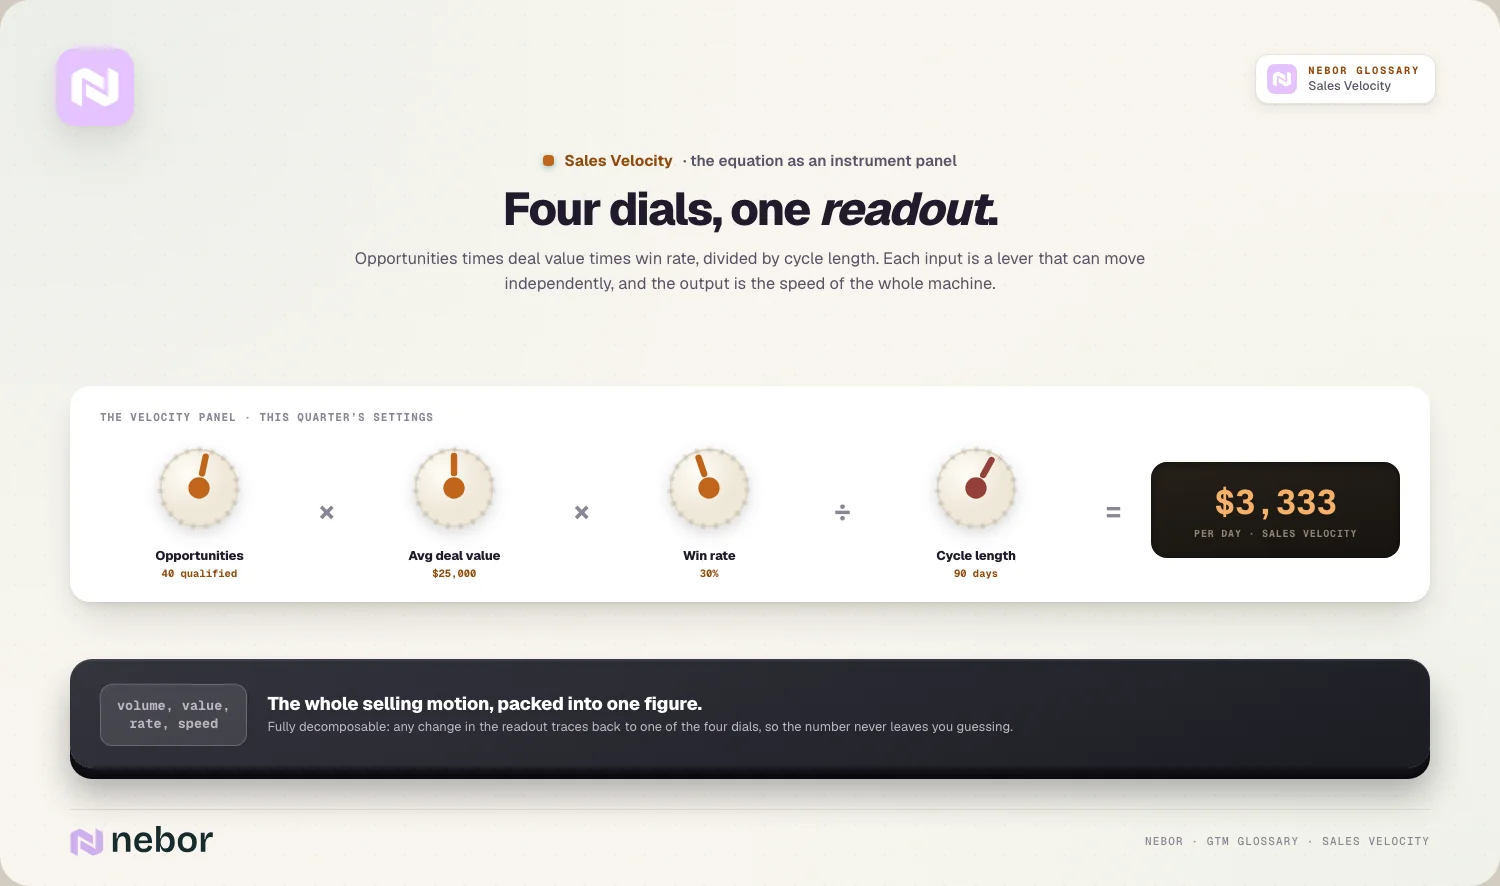
Sales velocity is the rate at which your team generates revenue, calculated as the number of opportunities times average deal value times win rate, divided by sales cycle length. The result is a dollars-per-day figure that captures how fast your pipeline produces money.
The metric is essentially the same as pipeline velocity, and the two names get used interchangeably. Where a fuller treatment of the calculation lives under pipeline velocity, this entry focuses on using the equation as a diagnostic to find and fix what's holding your revenue back.
TL;DR
Sales velocity is how fast your team turns pipeline into revenue, calculated from opportunities, deal value, win rate, and cycle length as dollars per day.
Its real power is diagnostic, because breaking the single number into its four inputs shows exactly which lever is holding your revenue back.
It works at any level, so you can calculate it per rep, segment, or territory to see who is truly productive instead of just who closed the most.
There's no universal benchmark, so the honest comparison is against your own history, watching whether your velocity is rising or falling over time.
What the sales velocity equation is made of, one input at a time
Sales velocity combines four inputs into one number. Each input is a lever, and understanding them is what makes the metric useful instead of abstract.
The four variables are simple to gather. You multiply the number of qualified opportunities by the average deal value and the win rate, then divide by the sales cycle length in days.
The result comes out as dollars per day. That figure tells you how much revenue your pipeline produces over a given period, which is a far more useful read than any static count of deals.
Each variable works as a distinct lever. Opportunities, deal value, win rate, and cycle length can each move independently of the others, so the single number is really four numbers working together.
So the equation packs your whole selling motion into one figure. It's a compact summary of volume, value, effectiveness, and speed, and that compactness lets it stand in for the overall health of the team.
The elegance is that it's fully decomposable. Any change in the final number traces back to one of the four inputs, so the metric never leaves you wondering where a shift came from.
Why sales velocity is more useful as a diagnostic than a scoreboard
The number itself matters less than what it reveals when you take it apart. Sales velocity earns its keep as a diagnostic tool.
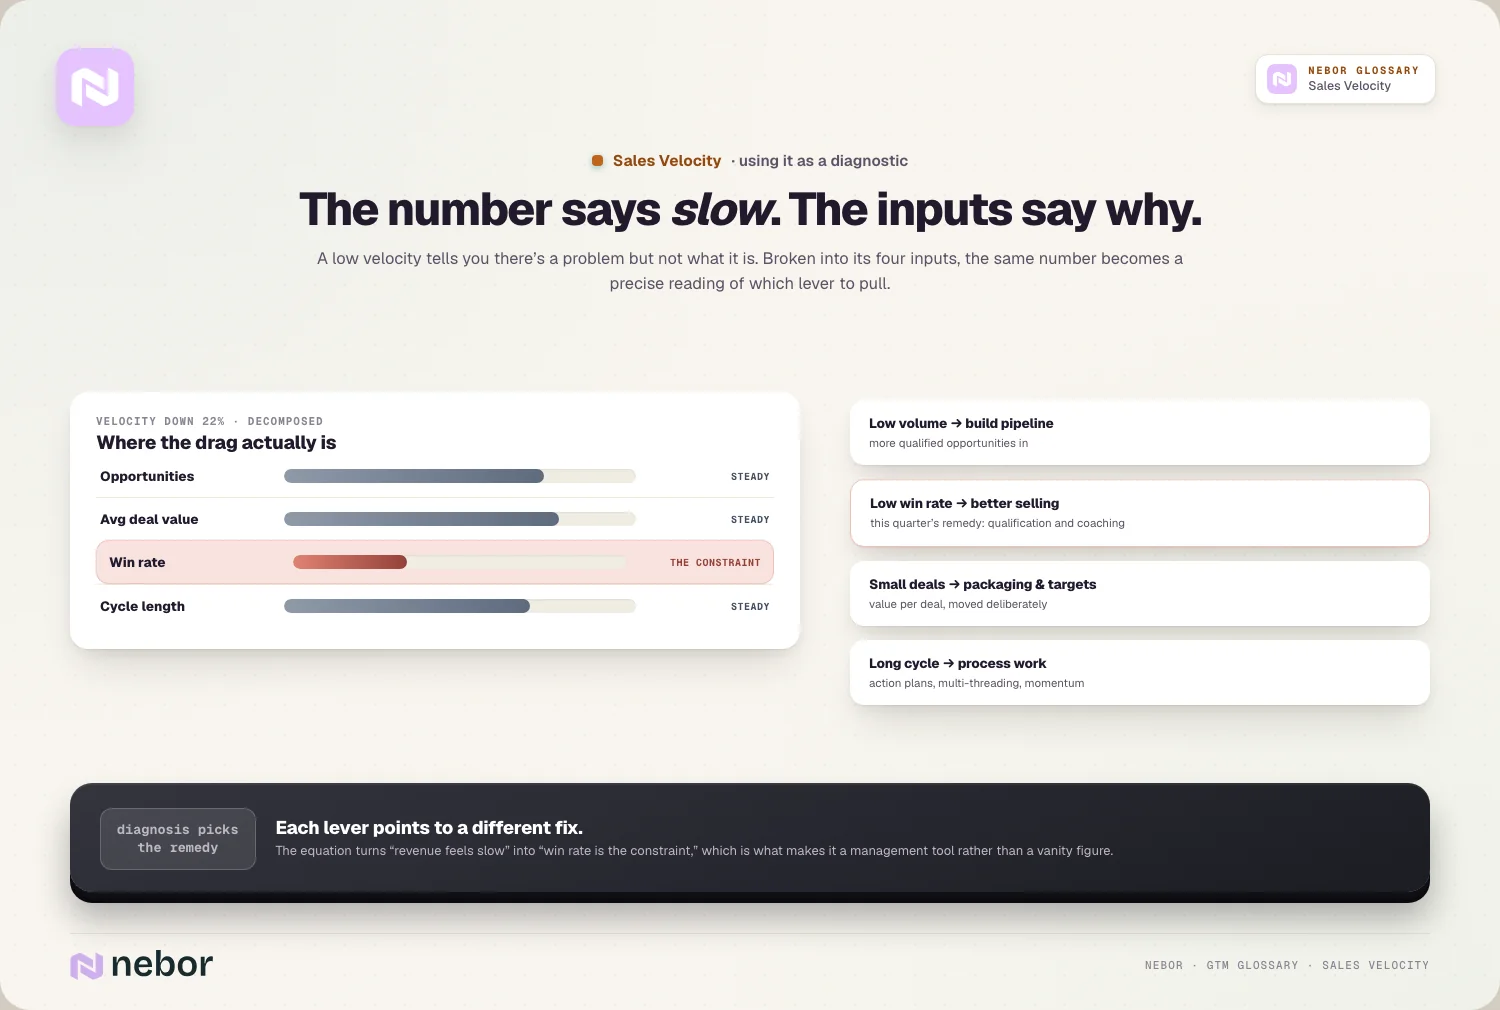
The single figure hides the underlying cause. A velocity that's too low tells you there's a problem but not what it is, so the number alone isn't actionable.
Breaking it down is what finds the constraint. Looking at each of the four inputs shows which one is dragging velocity down, so you can target the actual bottleneck instead of guessing.
Each lever points to a different fix. Low volume calls for more pipeline, a low win rate calls for better selling, and a long cycle calls for process work, so the diagnosis dictates the remedy.
So sales velocity is most valuable when you decompose it, and we tell clients to do exactly that before reacting to any dip. The equation turns a vague sense that revenue is slow into a precise reading of which lever to pull, and that precision makes it a real management tool instead of a vanity figure.
How breaking velocity down by rep exposes each seller's real productivity
One of the sharpest uses of sales velocity is comparing people, and it reveals things a revenue total never could. It distills each rep to a comparable number.
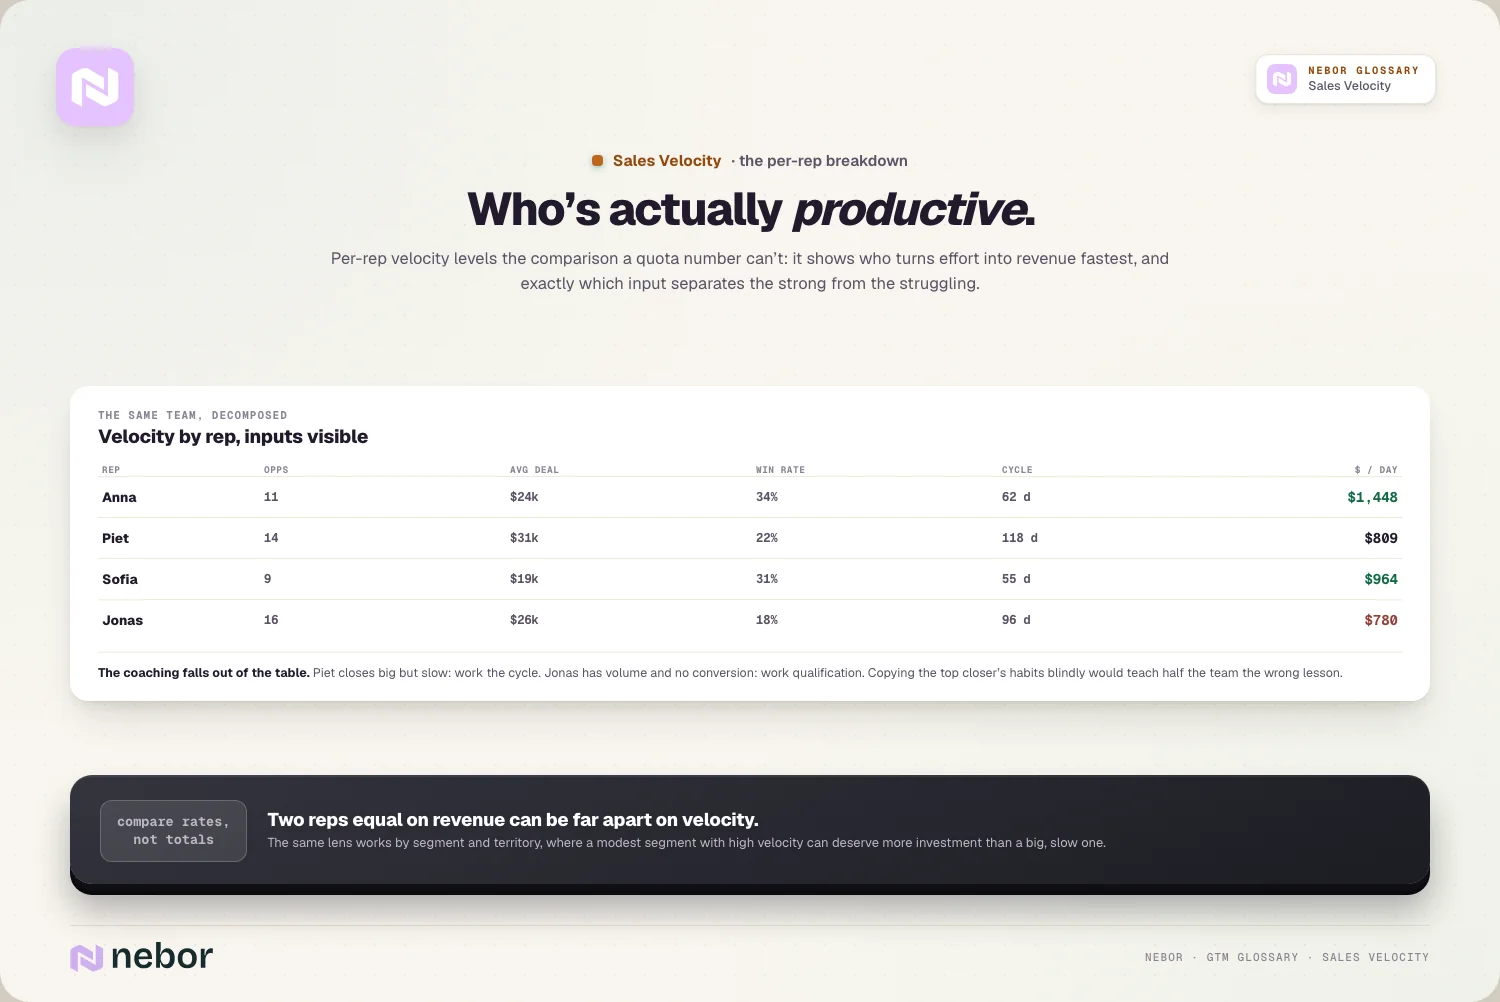
It levels the comparison between your reps. Two reps who closed the same amount can have very different velocities, because breaking it down by rep shows who produced revenue faster and more efficiently.
It explains the performance gaps you see. Comparing a top rep's velocity inputs to an average one shows exactly where the difference lies, whether in win rate, deal size, or speed.
It guides the coaching conversations that follow. Once you see which input separates strong reps from weak ones, you know what to coach, so improvement is targeted instead of generic.
So per-rep velocity turns a fuzzy sense of who's good into a precise picture. It reveals genuine productivity and points directly at what each rep needs to work on, which a quota number alone can't do.
It also protects against the wrong lesson. A rep who closes big but slow, and one who closes small but fast, can look equal on revenue, so velocity keeps you from copying the wrong habits across the team.
Why you should calculate sales velocity by segment and territory too
Beyond individual reps, splitting velocity across parts of the business reveals where it's strongest and weakest, and the breakdown guides where the investment goes.
Segments behave quite differently from each other. Enterprise and SMB deals have very different volumes, values, and cycles, so their velocities differ, and a blended number hides which segment is efficient.
Territories vary in exactly the same way. Comparing velocity across regions or markets shows where the motion works and where it struggles, which informs where to add resources.
It sharpens your targeting decisions as well. Seeing which segments produce the highest velocity tells you where your ideal customer profile is strongest, so you can focus effort there.
So segmenting velocity turns one company number into a map. It shows where your revenue engine moves fast and where it drags, so you can invest in the parts that pay off most.
The same breakdown can expose a hidden winner. A segment with modest total revenue but very high velocity may deserve more investment than a bigger one that closes slowly, which a headline number would never reveal.
Why chasing bigger deals can slow your velocity down overall
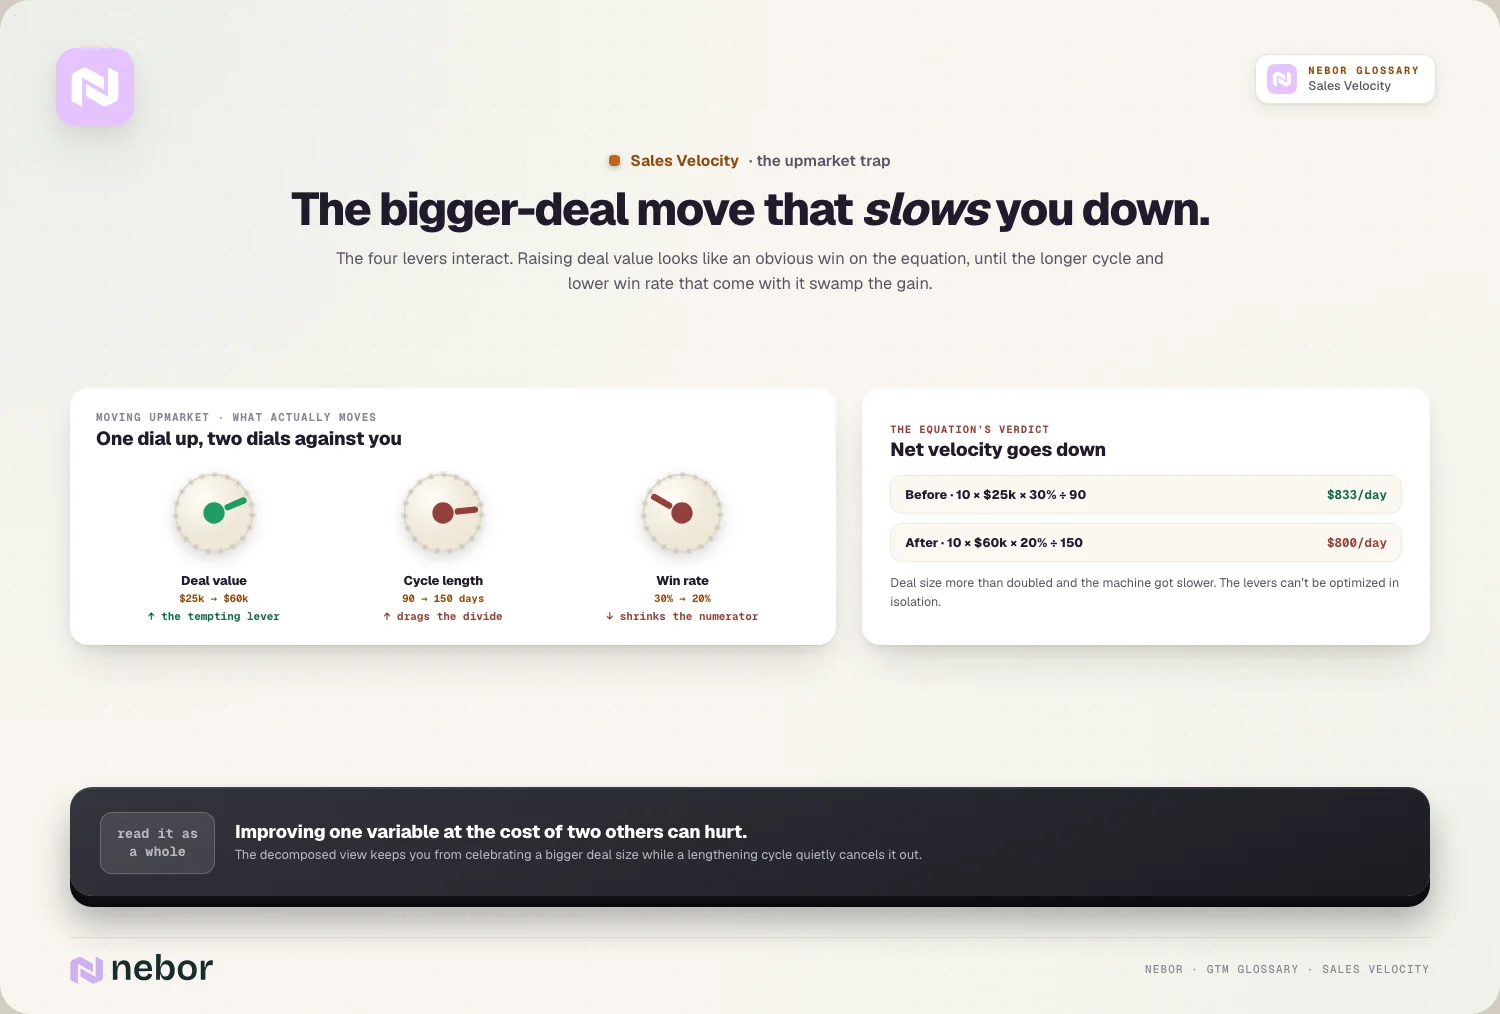
A subtle trap in sales velocity is that the four levers interact, so pulling one can move another. The deal-size lever is where this bites most.
Bigger deals always look tempting on paper. Raising average deal value lifts velocity directly, so chasing larger deals seems like an obvious win on the equation.
But large deals take longer to land. Enterprise deals carry longer sales cycles and lower win rates, so a bigger deal value can be offset by a slower, harder close.
The net effect can easily turn negative. If the added deal size is swamped by a much longer cycle and lower win rate, moving upmarket can lower your overall velocity.
So the levers can't be optimized in isolation. Improving one variable at the cost of two others can hurt velocity, so you read the equation as a whole instead of maximizing any single input.
This is exactly why the decomposed view matters. Seeing all four inputs at once keeps you from celebrating a bigger deal size while a lengthening cycle cancels it out unnoticed.
How win rate and cycle length tend to move velocity the most
Not all four levers are equal, and two of them tend to move velocity hardest. Knowing which ones give the most return helps you prioritize.
Win rate works as a powerful multiplier. Because it multiplies the whole numerator, a better win rate lifts velocity sharply, and improving it costs nothing in volume.
Cycle length divides everything else in the equation. Because it is the denominator, shortening the cycle raises velocity directly, and that's the reason compressing time-to-close is such a common focus.
Volume and value both have natural limits. Adding opportunities and raising deal size both help, but each has practical ceilings, whereas better conversion and faster cycles often have far more room left to improve.
So the highest-return levers are usually win rate and cycle length. Both improve efficiency instead of just adding more, which tends to move velocity further than piling on more deals.
Why there is no universal benchmark you can hold sales velocity to
A question clients ask us constantly about velocity is what a good number looks like, and the honest answer frustrates people, because there's no external standard you have to hit.
The number is specific to your company, and we advise clients to stop hunting for a universal one. Velocity depends on industry, deal size, model, and product complexity, so no universal benchmark exists to compare against.
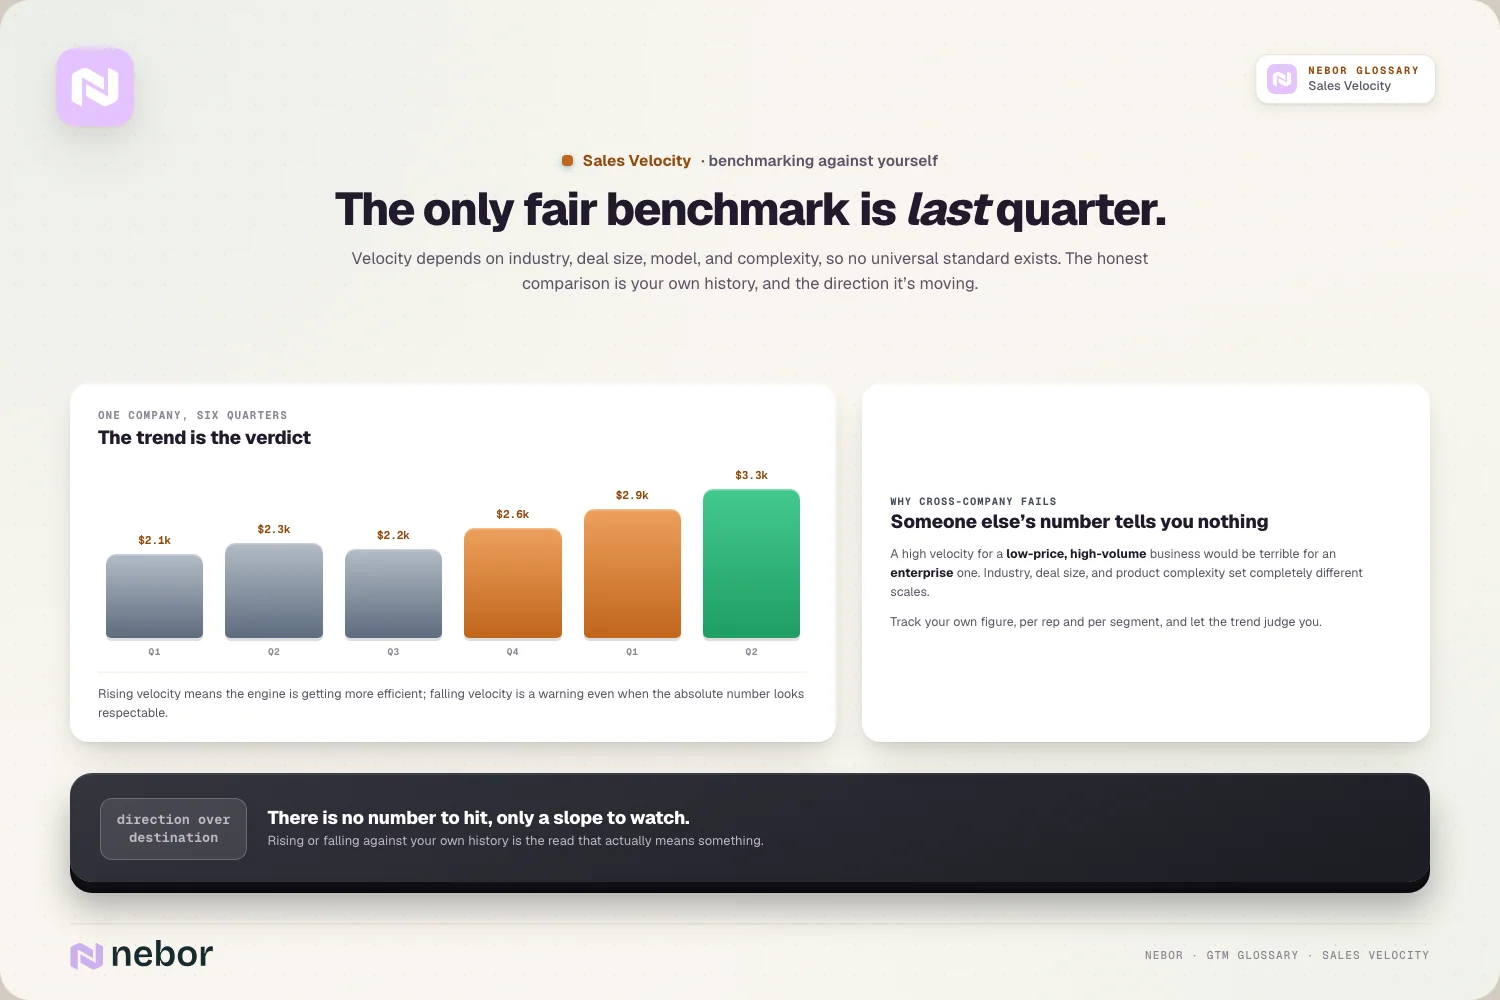
Comparison across companies misleads more than it informs. A high velocity for a low-price, high-volume business would be terrible for an enterprise one, so comparing your figure to another company's tells you little.
Your own history is the only fair benchmark. The useful comparison is against your past velocity, watching whether it's rising or falling, which reflects real change in your motion.
So the right benchmark is you, over time. Velocity is a trend to improve instead of a target borrowed from someone else, and that framing keeps the comparison meaningful.
How to use sales velocity as an early forecast health signal
Modern revenue teams treat velocity as more than a report card, using it to see problems coming, because it works as a genuine leading indicator.
A weekly read beats a quarterly one. Leading teams track velocity weekly as a forecast health check instead of a quarterly metric, so they catch issues while there's still time to act.
Falling velocity warns you while there's time. A dropping velocity signals trouble before it shows up in missed quota, because it reflects the inputs that produce revenue instead of the result.
It ties directly to your quota attainment. Because velocity predicts how much revenue will flow, it's a strong leading signal for eventual quota attainment, which lets leaders steer instead of react.
So velocity works as a forward-looking gauge on top of a rearview number. Watching it frequently turns it into an early warning system for the quarter, which is far more useful than reviewing it after the fact.
The weekly rhythm is what unlocks that. A number checked once a quarter can only explain a miss, while one checked weekly can help you prevent it while there's still runway.
How sales velocity connects to pipeline coverage and conversion
Sales velocity doesn't stand alone, it interlocks with the other pipeline metrics. Reading them together gives a fuller picture than any one alone.
Coverage feeds the volume lever from upstream. Enough pipeline coverage is what supplies the opportunities that velocity's first variable counts, so thin coverage caps velocity.
Conversion supplies the win-rate lever of the equation. The conversion rate through your stages is effectively the win rate in the equation, so improving conversion directly raises velocity.
Forecast accuracy depends on it more than most realize. A stable velocity makes revenue predictable, which strengthens forecast accuracy across the business.
So velocity is the center of a web of pipeline metrics. Each one feeds a lever of the equation, so velocity works best read alongside them instead of in isolation.
How to raise your sales velocity without gaming the number itself
Improving velocity is straightforward in principle, because you have exactly four levers to work with. The skill is pulling them without hurting the others.
Add qualified volume with real care and patience. Building more genuine opportunities lifts the first lever, as long as the new pipeline is real instead of padding that drags your win rate down.
Improve the win rate through better selling. Sharper qualification, a strong revenue engine, and good enablement close more of what you have, which multiplies through the whole equation.
Compress the cycle with deliberate, proven tactics. Removing delays and stalls shortens the denominator, which raises velocity without needing a single extra deal.
So raising velocity is about improving the inputs instead of inflating them. Real gains come from better conversion, faster cycles, and properly qualified volume, which lift the number honestly instead of on paper.
The common mistakes teams make when they track sales velocity
Sales velocity gets misused in a few predictable ways, and each blunts its value. Avoiding them keeps the metric a sharp tool.
The biggest is watching the single number. Tracking overall velocity without breaking it into its four inputs tells you something's wrong but never what.
Another is comparing your number to other companies. Chasing an external benchmark ignores that velocity is entirely relative to your own model and history.
A third is optimizing one lever blindly. Pushing deal size or volume without watching cycle length and win rate can lower velocity even as one input rises.
The last is counting opportunities that were never qualified. Padding the opportunity count with weak deals inflates velocity on paper while hiding a real problem, so the input has to be qualified for real through solid lead qualification.
Why sales velocity is the equation that focuses your whole team
The lasting value of sales velocity is that it gives everyone a shared, precise way to talk about revenue speed. It turns a vague goal into four concrete levers.
It aligns the whole team on causes. Instead of arguing about whether results are good, the equation points at which input to improve, so effort goes to the actual constraint.
It rewards efficiency over raw activity every time. Because it measures revenue per day, velocity values closing faster and better over simply doing more, which is the right thing to optimize.
It compounds when you improve the inputs. Each lever you lift multiplies through the equation, so steady gains in conversion and speed produce outsized gains in velocity.
A team that watches sales velocity and works its four levers deliberately has one of the clearest engines for growth in a modern go-to-market system. It's the equation that turns the pipeline you automate sales prospecting to build into revenue as fast as your motion allows.
Share this post
RevOps
Glossary
Related glossary items
Understanding the core GTM concepts




Ready to build your pipeline