

In this post:
Most teams discover they were short on pipeline far too late, usually near the end of a quarter when there's no time left to build more. The deals in play simply weren't enough, and by the time that's obvious, the number is already missed.
Pipeline coverage is the metric that warns you early. It compares the pipeline you have to the target you need to hit, so you can tell weeks in advance whether you're carrying enough opportunities to make your number or heading for a shortfall.
Pipeline coverage is the ratio of your total qualified pipeline value to your sales target for a period. A coverage of 4x means you have four dollars of pipeline for every dollar of quota you need to close.
The ratio exists because not every deal closes. Because only a fraction of your pipeline will convert, you need considerably more pipeline than target, and coverage tells you whether you have enough cushion to survive that fallout.
TL;DR
Pipeline coverage is your total qualified pipeline divided by your sales target, showing whether you have enough opportunities in play to realistically hit your number.
The right ratio is set by your win rate. If you close 25% of deals you need about 4x coverage, because roughly three of every four dollars in pipeline won't convert.
Most B2B teams aim for 3x to 5x, with enterprise motions needing more because their win rates are lower and cycles longer.
The number is only honest if the pipeline is real. Counting stalled or unqualified deals inflates coverage and creates false confidence, so you strip those out before you calculate.
What pipeline coverage tells you about the quarter ahead of you
Pipeline coverage answers one blunt question, which is whether you have enough opportunities to hit your target. It measures the gap between the pipeline you hold and the number you owe.
It's a ratio instead of a raw amount. You express it as a multiple of your target, so a million in pipeline against a quarter-million quota reads as 4x coverage.
It accounts for deals falling through along the way. Because most opportunities never close, coverage tells you whether you have enough in play to survive that loss and still hit target.
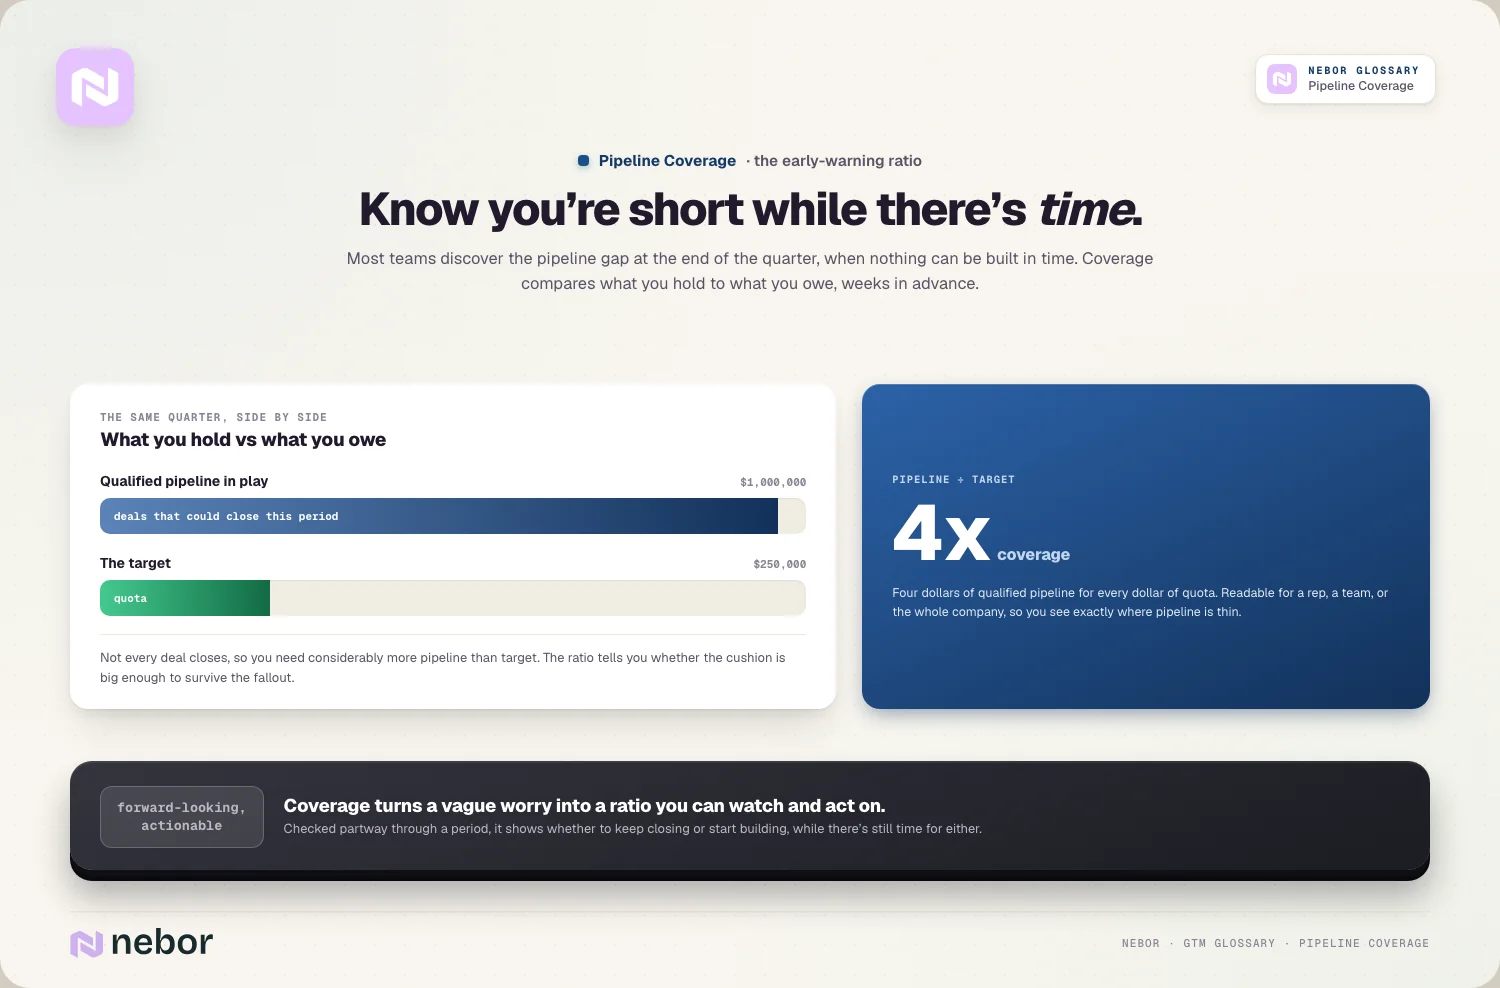
It works as an early warning system. Checked partway through a period, coverage shows whether you're on track or need to build more pipeline while there's still time to act.
So coverage is a forward-looking health check on the quarter ahead. It turns a vague worry about whether you'll make the number into a concrete ratio you can watch and act on well before the period ends.
It scales to any level of the org too. You can measure coverage for a single rep, a team, or the whole company, which lets leaders see exactly where pipeline is thin instead of only spotting the gap in the total.
How you calculate pipeline coverage without kidding yourself
The formula is simple, and the honesty of the inputs is where it lives or dies. A clean calculation depends on counting only real pipeline.
The math is a single, quick division. You take your total qualified pipeline value and divide it by your sales target for the period, and the result is the coverage multiple you carry.
An example makes the math easy to hold. A pipeline worth a million dollars against a quarter-million quota is 4x coverage, meaning four dollars in play for every dollar needed.
The denominator is your target for the period. That's your quota or revenue goal, so coverage always measures pipeline relative to what you have to deliver instead of as an abstract number.
So the calculation is easy, but the number only means something if the pipeline feeding it is genuine. A clean input is what separates useful coverage from a comforting illusion.
The timing of the measurement matters too. Coverage is usually read for a specific period, so you compare the pipeline expected to close in that window against that window's target, instead of lumping in deals that will land much later.
Why your win rate decides the coverage ratio you genuinely need
There's no single correct coverage number, and the reason is win rate, because how much pipeline you need depends entirely on how much of it converts. We work through this calculation with clients before setting any target.
Coverage exists to compensate for the losses. Because most deals don't close, you need enough pipeline that the fraction which does still adds up to your target.
The math ties directly to your win rate. The coverage you need is roughly one divided by your win rate, so a 25% win rate calls for about 4x and a 33% win rate for about 3x.
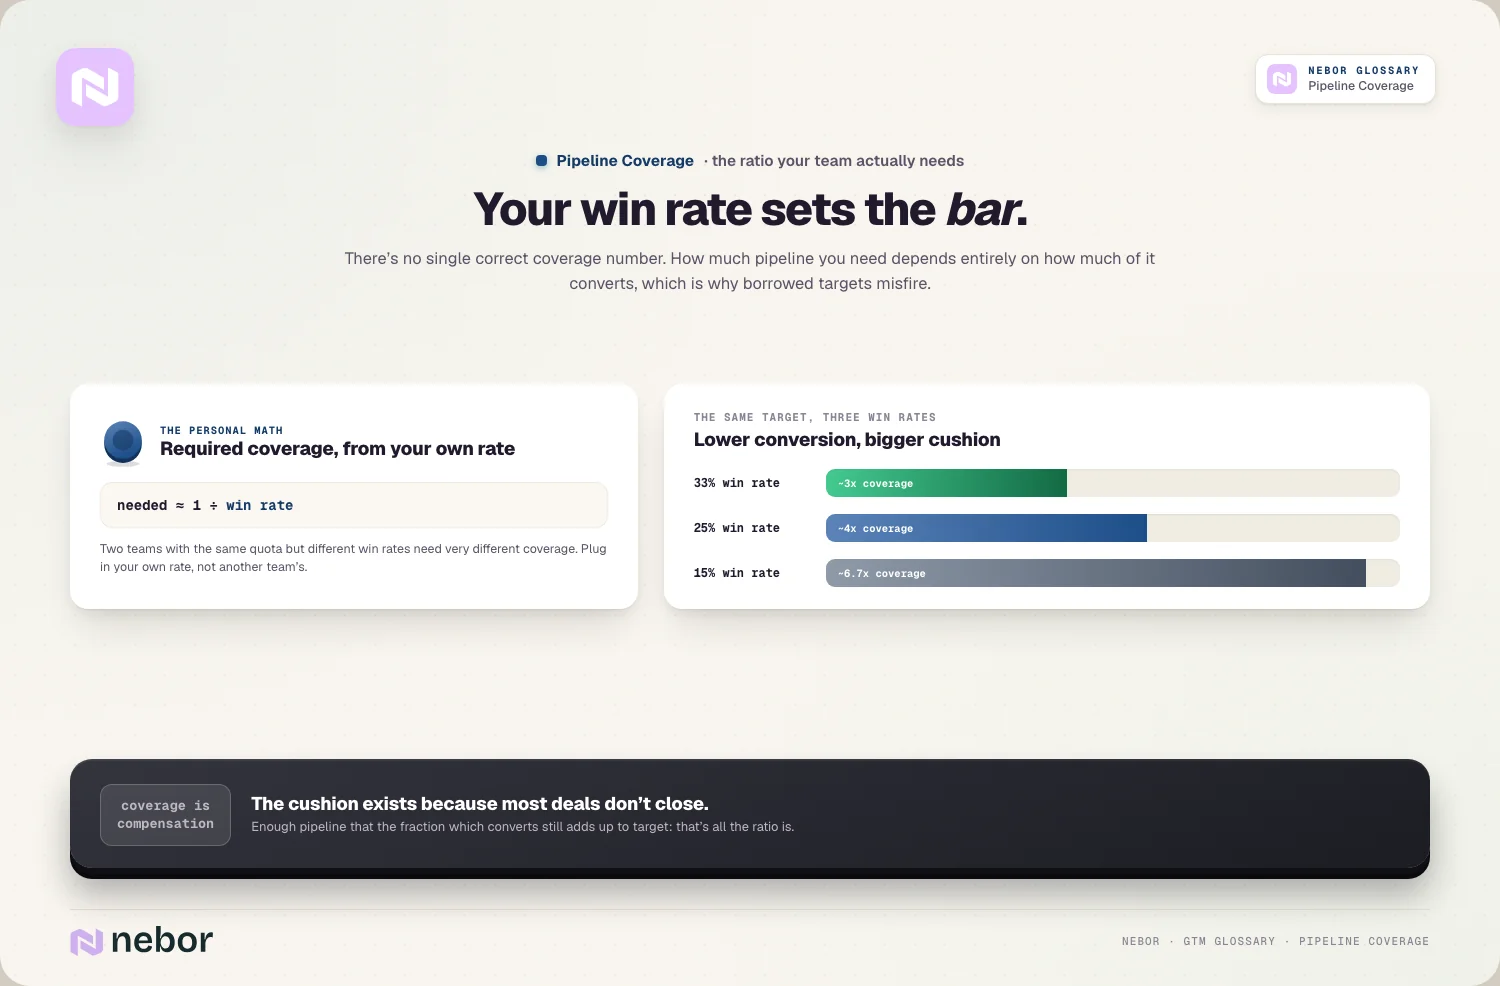
A lower win rate demands more cushion. If you close a smaller share of deals, you need proportionally more pipeline to hit the same target, which pushes your required coverage higher.
This is why a generic target is risky. Two teams with the same quota but different win rates need very different coverage, so borrowing another team's number can leave you badly over or under covered.
So the right ratio is personal to your team. Plugging in your own win rate gives you a target coverage that fits your reality, instead of a generic rule that may not.
Why the classic 3x rule of thumb misleads so many sales teams
The most quoted coverage figure is 3x, and it's wrong for a lot of teams. The rule hides an assumption most people never check.
The 3x rule assumes a 33% win rate. It only holds if you close a third of your deals, which is higher than many B2B teams manage.
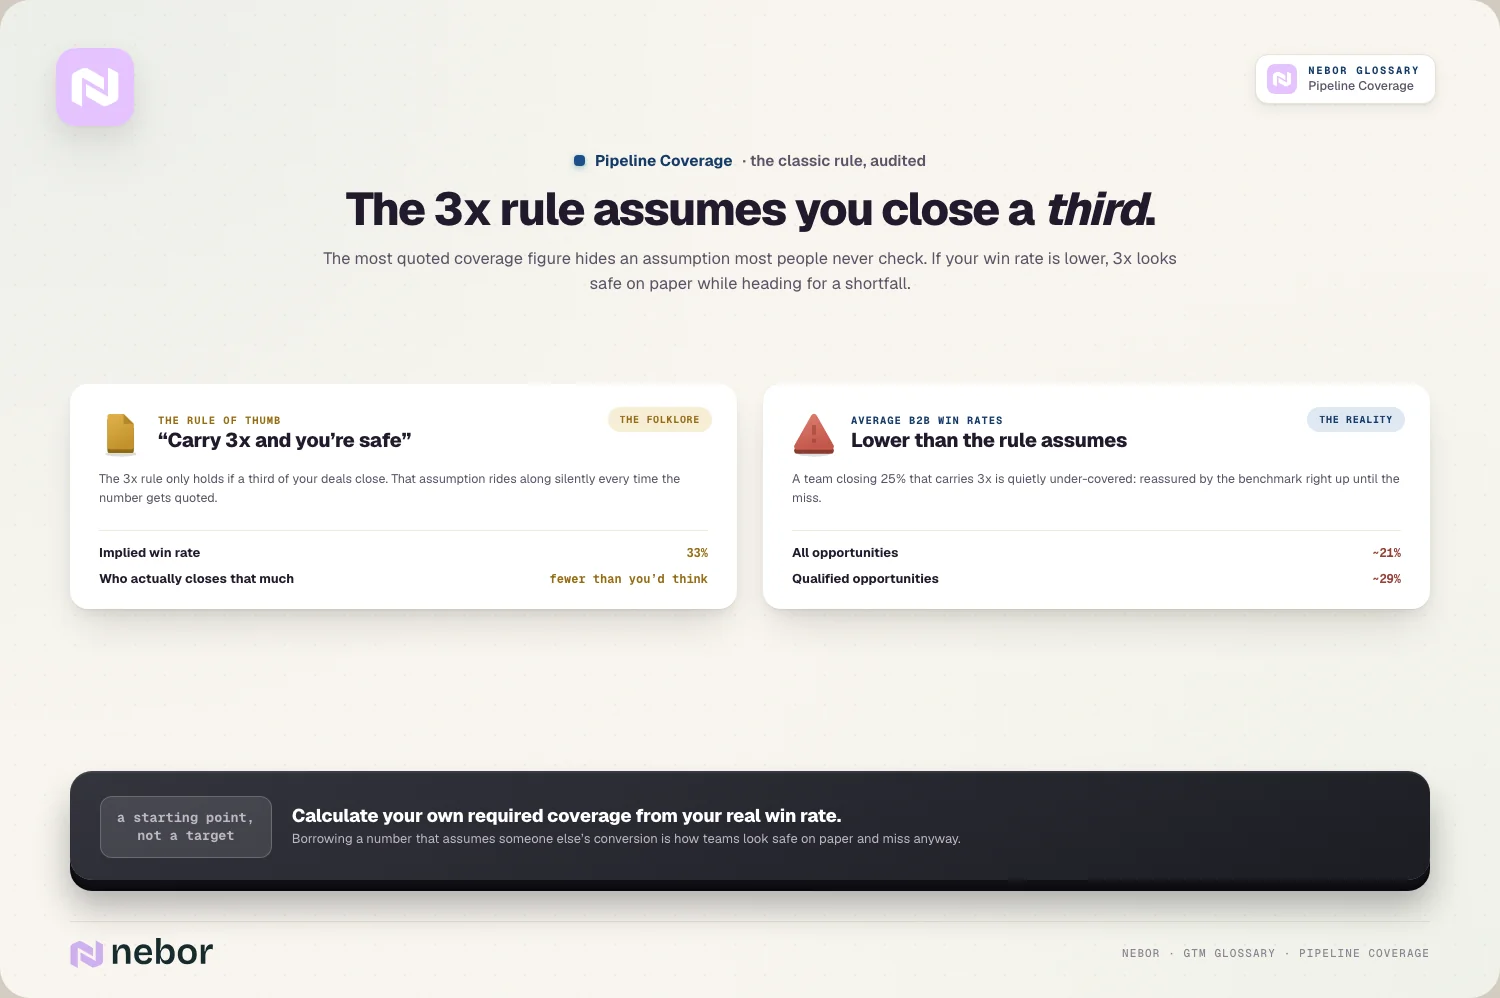
Real win rates are often lower than that. Average B2B win rates are closer to 21% across all opportunities and 29% for qualified ones, which means 3x leaves many teams short.
Following 3x blindly causes very real misses. A team closing 25% that carries only 3x coverage is under-covered without knowing it, so it looks safe on paper while heading for a shortfall.
So the 3x rule is a starting point instead of a target. The honest move is to calculate your own required coverage from your real win rate instead of trusting a number that assumes someone else's.
How coverage targets shift across mid-market and enterprise deals
The coverage you need changes with the kind of deals you sell. Bigger, slower deals demand a larger cushion than fast, transactional ones.
Mid-market motions get by on moderate coverage. With 60 to 90 day cycles and 25 to 40% win rates, mid-market teams typically target somewhere around 2.5x to 4x.
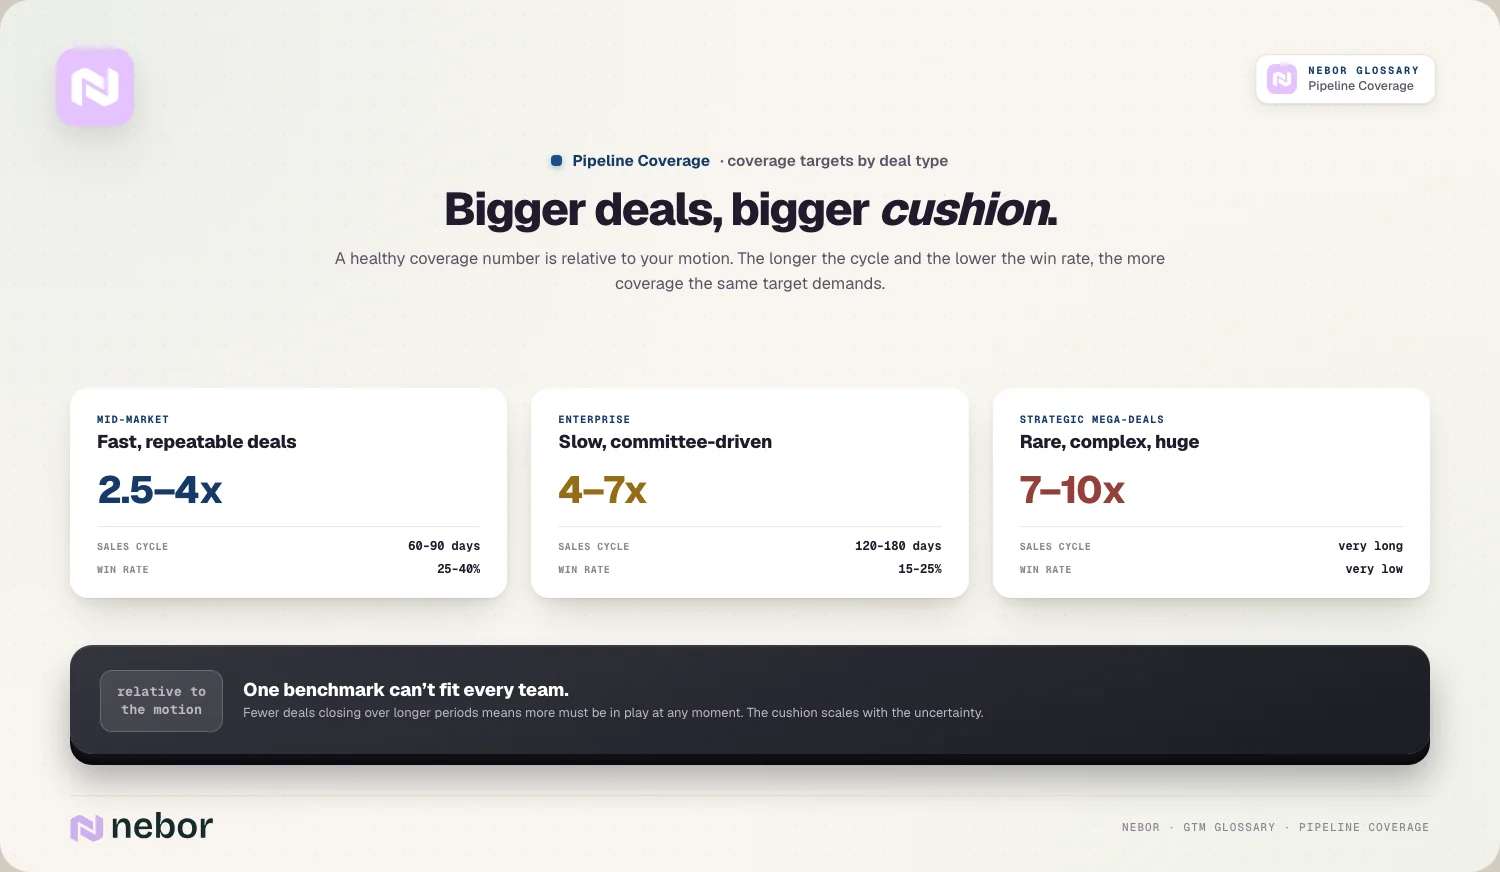
Enterprise motions need a far bigger cushion. With 120 to 180 day cycles and 15 to 25% win rates, enterprise motions often need 4x to 7x, because fewer deals close over longer periods.
Mega-deals need the biggest cushion of all. Strategic deals with very low win rates and long cycles can require 7x to 10x coverage, reflecting how rarely such large, complex deals land.
So a healthy coverage number is relative to your motion. The longer your sales cycle and the lower your win rate, the more coverage you need, so one benchmark can't fit every team.
Why counting junk pipeline is the fastest way to fool yourself
The most common failure in coverage is the inputs instead of the math. A number built on inflated pipeline gives dangerous false comfort.
Not all pipeline in your CRM is real. Stalled deals, unqualified opportunities, and deals logged just for activity tracking pad the total without any real chance of closing.
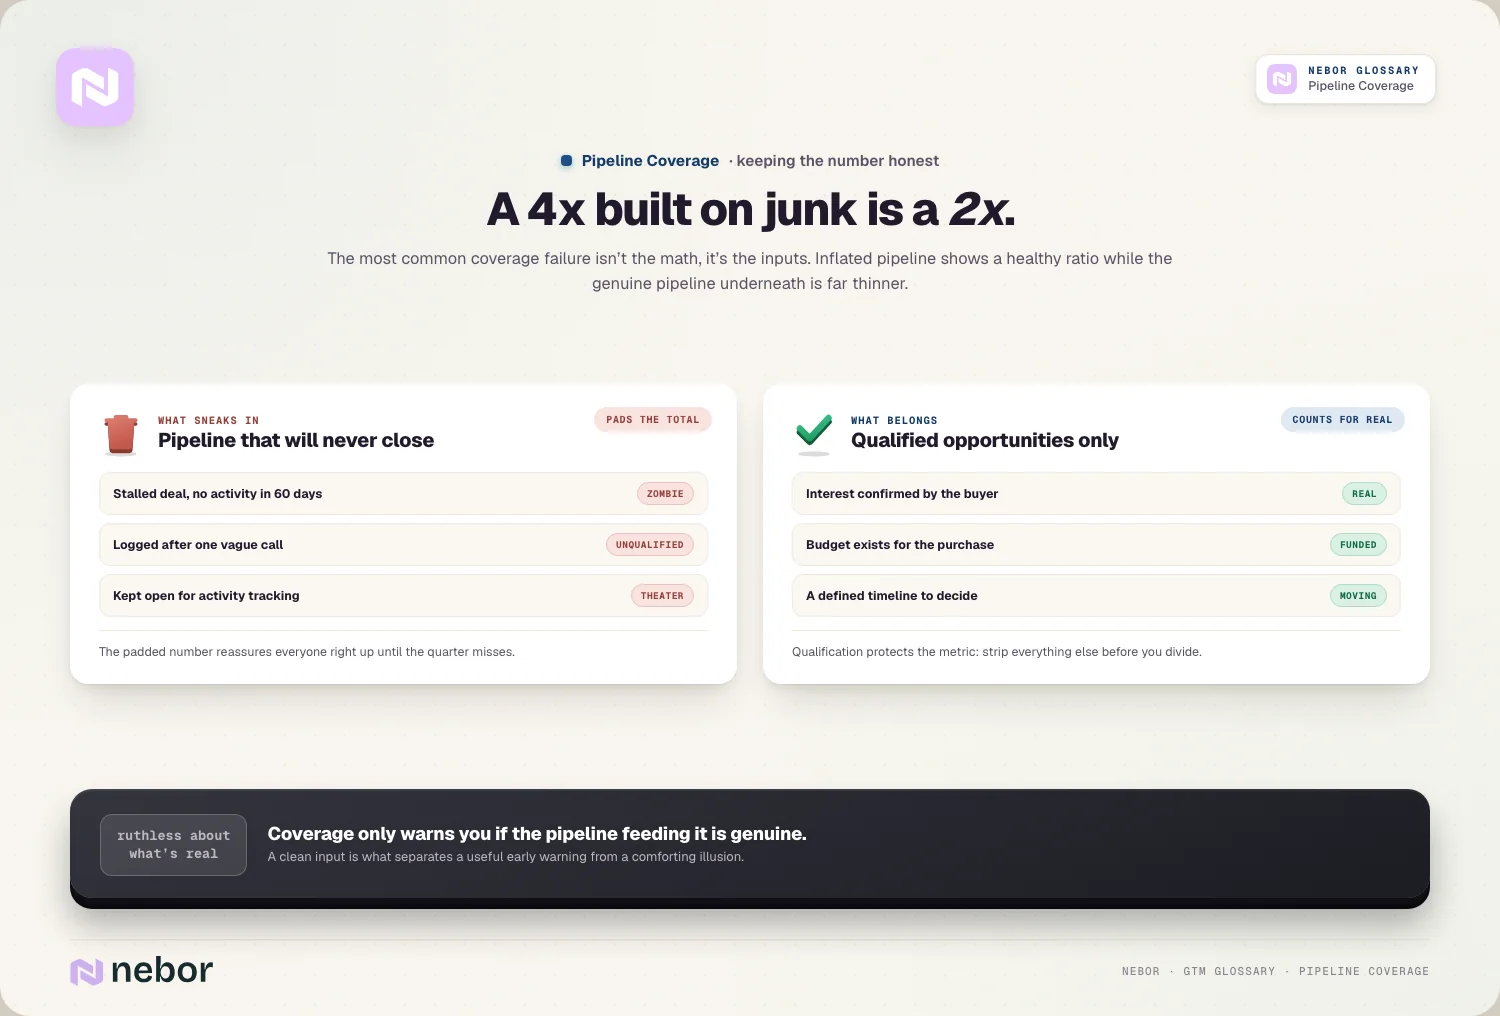
Inflated pipeline hides a very real shortfall. A team counting junk can show a healthy 4x coverage while its genuine pipeline is far thinner, so the number reassures right up until the miss.
Only qualified deals should make the count. Real coverage counts opportunities where interest is confirmed, budget exists, and a timeline is defined, which is where lead qualification protects the metric.
So the discipline is ruthless honesty about what's real, and we tell clients to prune before they ever calculate. Stripping out the deals that will never close gives you a coverage number you can trust to guide decisions.
How pipeline coverage connects to your win rate and conversion
Coverage is tightly linked to the rates at which your deals move and close, because those rates are what make a given coverage enough or not.
Win rate sets the whole coverage requirement. A higher conversion rate through your pipeline means you need less coverage, because more of what you have will close.
Improving conversion lowers what you need to carry. If you close a bigger share of deals, the same target needs less pipeline, so better conversion eases the pressure to constantly build more.
The two work as levers on the same goal. You can hit your number by building more pipeline or by converting more of it, and coverage plus win rate together show which lever to pull.
So coverage and conversion are two sides of hitting quota. Watching them together tells you whether your problem is too little pipeline or too much of it leaking before the close.
This also reframes coverage as an efficiency question. A team with a strong revenue engine and a high win rate can hit its number on less coverage, while a leaky one needs to carry far more pipeline to reach the same target.
Why pipeline coverage is central to building an accurate forecast
Coverage is one of the foundations a believable forecast rests on. Without enough real pipeline, no forecast can be trusted.
A forecast assumes conversion is happening underneath it. Predicting what you'll close depends on having pipeline to close, so coverage is the raw material any forecast works from.
Thin coverage makes any forecast dangerously fragile. If you're barely covered, a single slipped deal can blow the quarter, which makes the forecast far riskier than a well-covered one.
Coverage improves your forecast accuracy quite directly. Healthy coverage gives the forecast room for normal deal fallout, so the prediction holds even when some deals slip or die.
So coverage and forecasting are deeply linked. A forecast built on thin or inflated pipeline is a guess, while one built on healthy, qualified coverage is a projection you can plan around.
How pipeline coverage differs from pipeline velocity and quota attainment
Coverage stands next to a couple of other pipeline metrics, and mixing them up leads to bad conclusions. Each answers a different question about the same pipeline.
Coverage asks whether you have enough in play. It measures the size of your pipeline against your target, so it's a question of volume relative to the number.
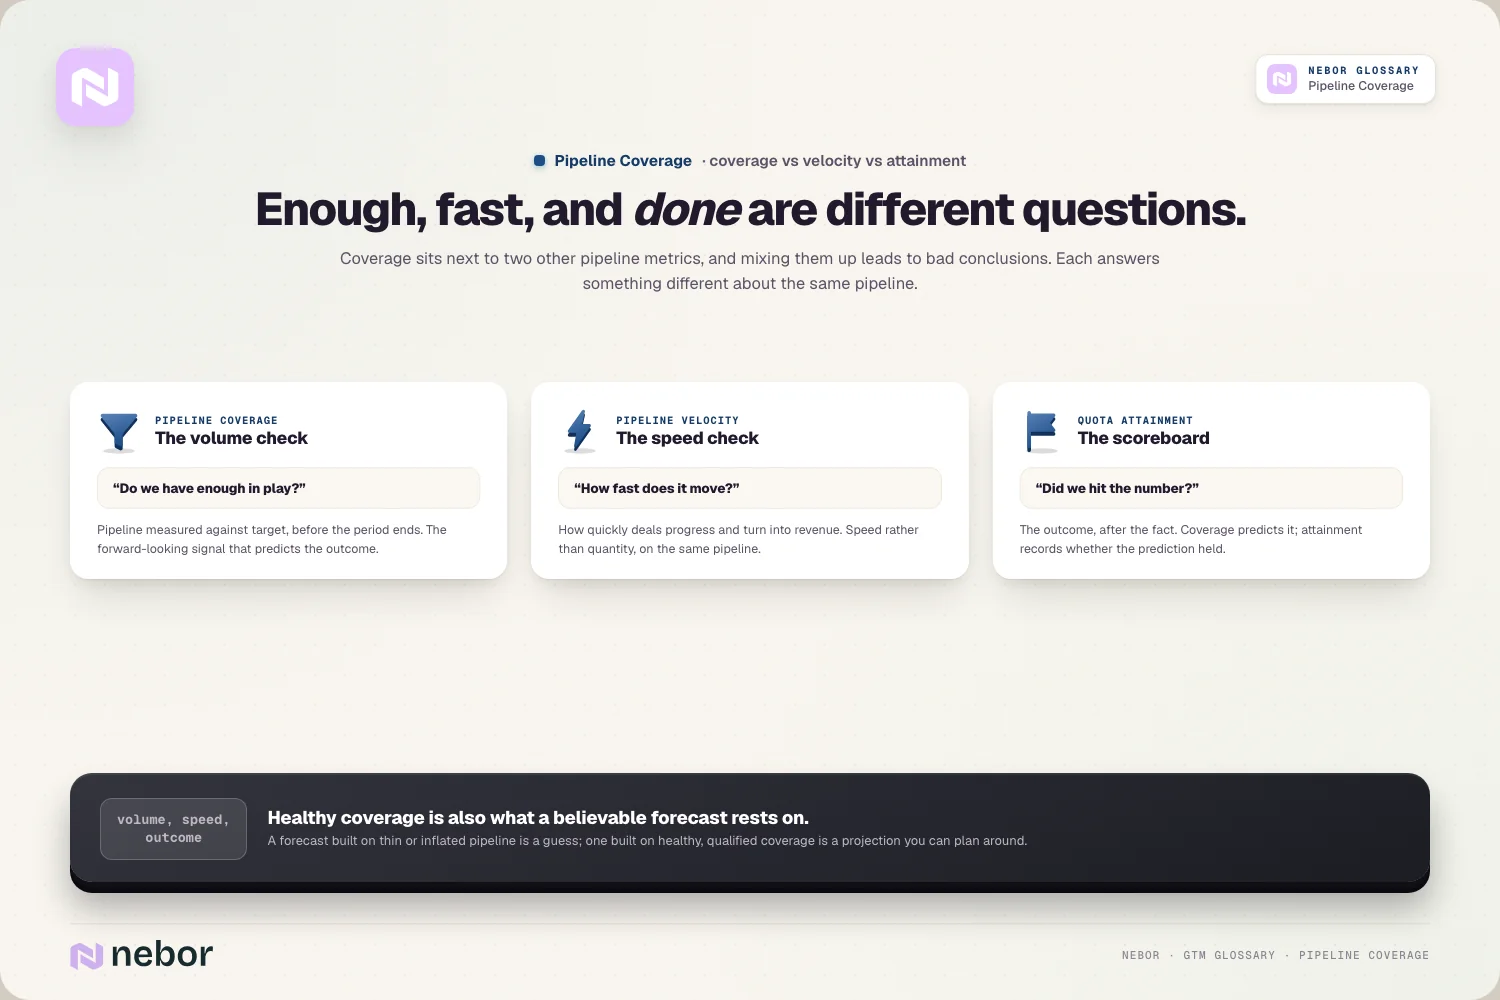
Pipeline velocity asks how fast it moves. It captures how quickly deals progress and generate revenue, which is about speed rather than sheer quantity.
Quota attainment measures the outcome at the end. It's about quota attainment after the fact, whereas coverage is the forward-looking signal that predicts it.
So coverage, velocity, and attainment form a sequence. Coverage tells you if you have enough pipeline, velocity tells you how fast it converts, and attainment tells you whether it all added up in the end.
How to fix a pipeline coverage problem before it costs you the quarter
When coverage gets thin, you have a limited set of levers, and in our experience the timing matters more than the choice of lever. Acting early is what separates a recoverable gap from a missed number.
The direct fix is building more pipeline. Creating more qualified opportunities through stronger lead generation raises the numerator, though new pipeline takes time to mature.
Improving conversion helps from the other side. Closing a larger share of existing deals means you need less coverage, so tightening your win rate eases a coverage gap from the other side of the same equation.
Better targeting raises the quality of what you build. Focusing on accounts that fit your ideal customer profile builds pipeline more likely to close, which counts for more than raw volume.
So fixing coverage is about acting while there's still time. Because pipeline takes weeks to build, spotting a gap early is what makes it fixable rather than a shortfall you can only watch arrive.
The common mistakes teams make when they track pipeline coverage
Pipeline coverage gets misused in a few predictable ways, and we keep seeing the same errors in the pipelines clients show us. Each one undermines the confidence the metric is supposed to give.
The biggest is counting unqualified pipeline as real. Padding the total with deals that won't close inflates coverage and produces false confidence right up to the miss.
Another is borrowing a generic ratio from elsewhere. Applying a blanket 3x without checking your own win rate leaves many teams under-covered without realizing it.
A third is checking too late in the period. Coverage is an early-warning tool, so looking at it near quarter-end wastes its main value, because there's no time left to build pipeline.
The last is ignoring the age of the deals. Pipeline that's technically qualified but stalled for months rarely closes, so treating it as live coverage overstates your real position.
A subtler error is treating coverage as a vanity target. Chasing a high ratio by generating low-quality pipeline hits the number on paper while filling the funnel with deals that were never going to close.
Why pipeline coverage works as a discipline rather than a one-off number
The value of pipeline coverage comes from watching it consistently instead of calculating it once. A team that tracks coverage throughout the period can steer, while one that checks at the end can only react.
The metric rewards honesty above everything else. A slightly lower coverage number built on real, qualified pipeline is far more useful than a flattering one padded with deals that will never close.
It turns a vague fear into a plan. Instead of hoping the quarter works out, coverage tells you weeks ahead whether to keep selling what you have or urgently build more.
Watched as a habit, pipeline coverage becomes one of the clearest early signals in a modern go-to-market system. It shows you whether the pipeline you automate sales prospecting to build is truly enough to carry the number you've promised.
Share this post
RevOps
Glossary
Related glossary items
Understanding the core GTM concepts




Ready to build your pipeline