
In this post:
Forecast accuracy is how close your sales forecast came to what you actually closed, usually written as a percentage: 100% minus the size of the miss. Call €1,000,000 for the quarter, close €900,000, and by the most common sales convention you were 90% accurate.
The arithmetic takes one line. What makes it slippery is that "the forecast" can mean several different numbers, depending on which week you froze it, which deal categories you counted and whether renewals sat in the same total. A team that grades itself on the friendliest version will look accurate right up to the quarter it misses by a mile.
It matters outside sales because most of the company's plans are built on that one figure. Finance sets hiring, spend and cash against it, so a miss in either direction turns into people hired too early, budgets frozen too late or money raised that nobody needed.
TL;DR
The usual formula is 100% minus |forecast − actual| ÷ actual × 100. The statistics textbooks divide by the actual; plenty of sales teams divide by the forecast, which turns a €1.0M call and a €900k close into 90% instead of 88.9%. Either works if you pick one and write it down.
Grade a frozen snapshot, such as the commit number at the end of week three, not the version revised on the last Friday of the quarter. A forecast that's allowed to move until the end will always look accurate.
Track bias next to accuracy. The signed error over four quarters shows whether the team keeps over-calling or sandbagging, and a deal-level check catches totals that came out right because two wrong calls cancelled each other.
Missing is common. In Xactly's 2024 survey of 405 sales and finance leaders, 4 in 5 had missed a quarterly forecast in the past year, and 52% of the sales leaders said their misses typically ran to 10% or more.
Judgment roll-ups, stage-weighted pipeline, forecast categories and predictive models all multiply your pipeline by something. Stage exit criteria, real close dates and clean CRM records move accuracy more than switching methods does.
A pipeline built from accounts that fit your ICP converts at steadier rates, which makes every forecasting method more accurate before anyone opens the spreadsheet.
The forecast accuracy formula
Most revenue teams use some version of this:
Forecast accuracy = 100% − (|forecast − actual| ÷ actual × 100)
The vertical bars mean you drop the sign, so a €100,000 over-call and a €100,000 under-call count as the same size of miss. That's deliberate. Over-calling has the company spending money that never arrives, and under-calling has it holding back hires it could have afforded. Both are planning failures, even if only one of them gets a sales leader in trouble.
The choice people argue about is the denominator. In their textbook Forecasting: Principles and Practice, Rob Hyndman and George Athanasopoulos define percentage error against the actual value, which is the convention behind MAPE (mean absolute percentage error). Many sales teams divide by the forecast instead, on the reasoning that the forecast was the promise being graded.
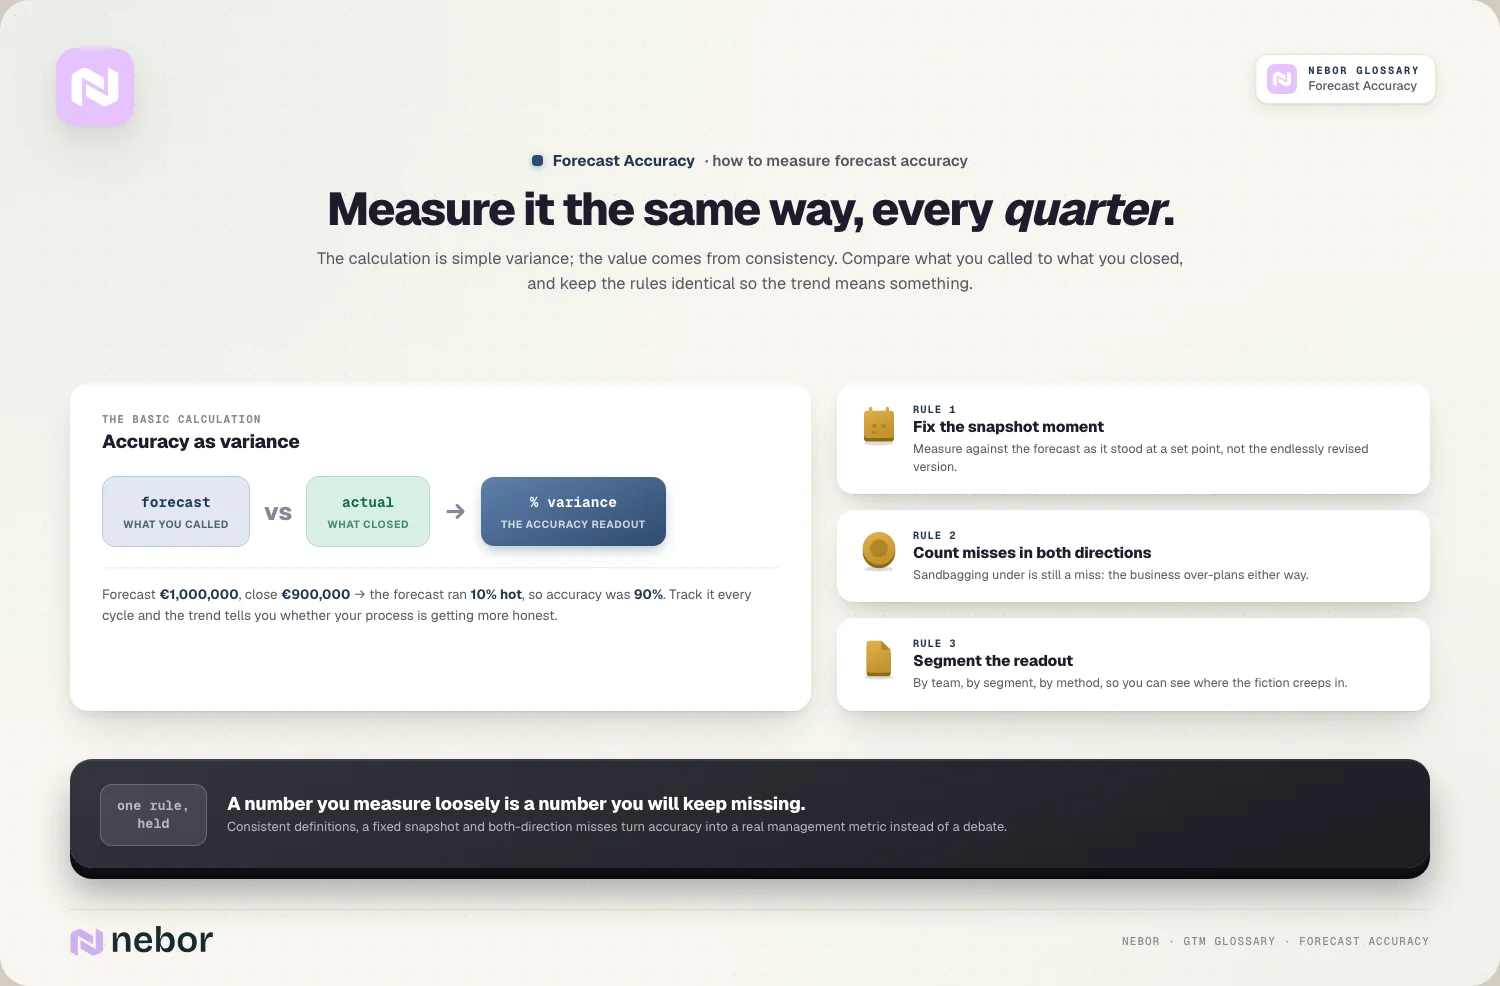
On a €1,000,000 call and €900,000 closed, the two conventions give slightly different answers. Divide by the actual and the miss is 11.1%, so accuracy is 88.9%. Divide by the forecast and the miss is 10%, so accuracy is 90%. Neither is wrong. Using both is, because then finance and sales bring two different scores for the same quarter to the same meeting.
The textbook also flags a practical trap. A percentage error relative to the actual blows up when the actual is zero or close to it, so a small segment where a rep called €40,000 and closed nothing produces a meaningless percentage. For thin segments and individual reps, report the miss in euros as well.
Which forecast are you grading?
A forecast isn't one number. It changes every week of the quarter, and it comes in layers. HubSpot's forecast tool sorts deals into categories (Not forecasted, Pipeline, Best case, Commit and Closed won), and it describes Commit as deals with a high likelihood of closing that have been committed to the forecast. Salesforce uses a similar ladder. Before you calculate anything, decide which layer and which week you're holding the team to.
Our default is to freeze the commit number at a fixed point early in the quarter, for example the end of week three, and grade that against what closed. That's the number finance actually planned on. We grade the week-nine call as well, as a separate score, because it tells you how well the team reads deals that are close to the line. Report them together and the late call flatters the early one.
Scope needs the same care. If new business, renewals and expansion all sit in one total, a strong renewal quarter can hide a badly called new-business quarter. For a subscription business, forecast the existing base separately, using your net revenue retention history, and grade new business on its own.
Decide, too, what happens to a deal that closes early from next quarter's pipeline. Counting it is fine, but note it. A quarter rescued by pulled-in deals is borrowing from the next one, and the forecast for that next one should shrink accordingly.
Accuracy and bias are two different numbers
An accuracy score with the sign removed tells you how big the misses were. It says nothing about which way they went, and the direction is often the more useful half. Here's a team's commit call over four quarters, in thousands of euros:
Quarter | Commit call | Closed | Accuracy | Signed error |
|---|---|---|---|---|
Q1 | 800 | 880 | 90.9% | −9.1% |
Q2 | 900 | 1,000 | 90.0% | −10.0% |
Q3 | 950 | 1,020 | 93.1% | −6.9% |
Q4 | 1,000 | 1,100 | 90.9% | −9.1% |
Four quarters at 90% or better looks like a team in control. The last column says otherwise. The team under-called every single quarter, by almost 9% on average, which is sandbagging: committing a number you're sure to beat so the quarter ends with a pleasant surprise. Finance spent the whole year planning on less revenue than the business was producing, and probably delayed hires it could have made in Q2.
The opposite pattern, a steady positive error, usually means reps are committing deals on hope and nobody is challenging them. Either way, a bias that holds for three or four quarters is a process problem you can fix, while random misses in both directions are closer to the noise you have to live with.
Totals can also come out right for the wrong reasons. If a €150,000 deal in commit slips to next quarter and an unforecast €140,000 deal lands, the quarter looks 99% accurate, yet both deal-level calls were wrong. So we add a second check: of the deals in commit at the snapshot, how many closed in the quarter for roughly the amount called? That figure tells you whether the team can read deals or just got lucky with the sum.
How far off is normal, and what a miss costs
Published benchmarks for forecast accuracy are thin, and most come from vendors who sell forecasting software. One of the more transparent is Xactly's 2024 Sales Forecasting Benchmark Report, a survey of 405 sales and finance leaders in North America. Four in five said they had missed a quarterly forecast in the past year, and over half had missed two or more times.

The detail we find more telling is the split by function. Two thirds of the finance leaders said their misses were usually under 9%, while 52% of the sales leaders said theirs were typically 10% or more. People from the same kind of company, looking at the same forecasts, came away with different impressions of how good they were. That's another reason to agree on one formula and one snapshot before anyone quotes an accuracy figure.
Treat the survey as a sign that missing is ordinary, not as a target. Your own trend, measured the same way every quarter, is a better yardstick than anyone's average.
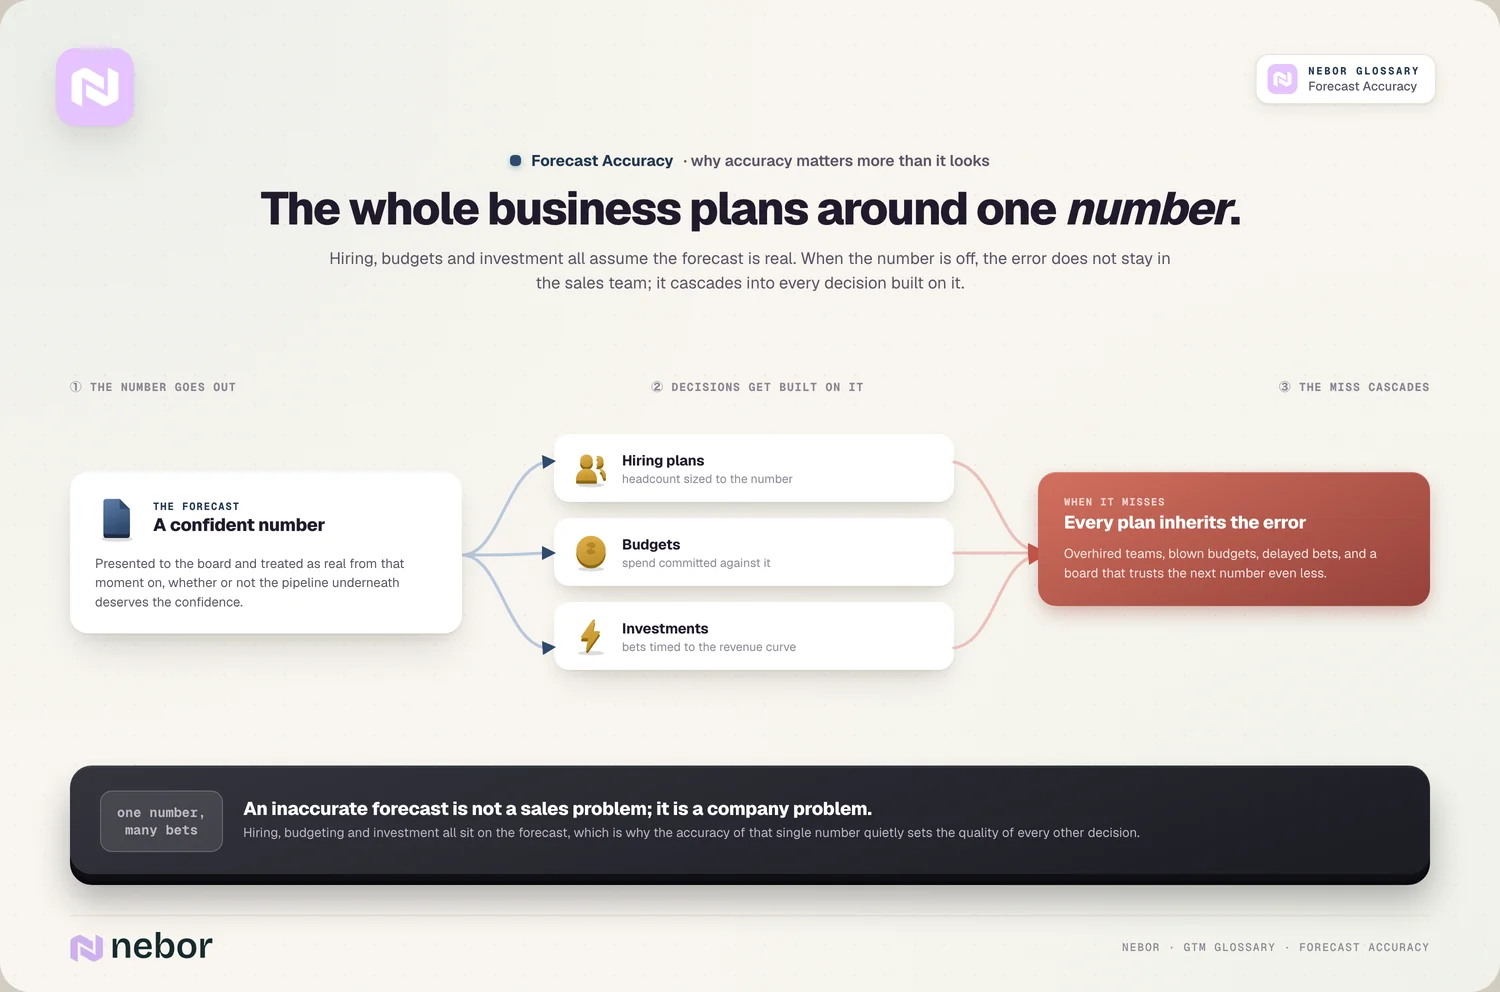
The cost of a miss lands outside the sales team. Headcount gets sized to the number, budgets are committed against it, and investments are timed to when the revenue should arrive. When the forecast turns out high, all of that was set up for revenue that doesn't exist, and the next number the sales leader brings to the board gets discounted before it's read.
Where the forecast number comes from
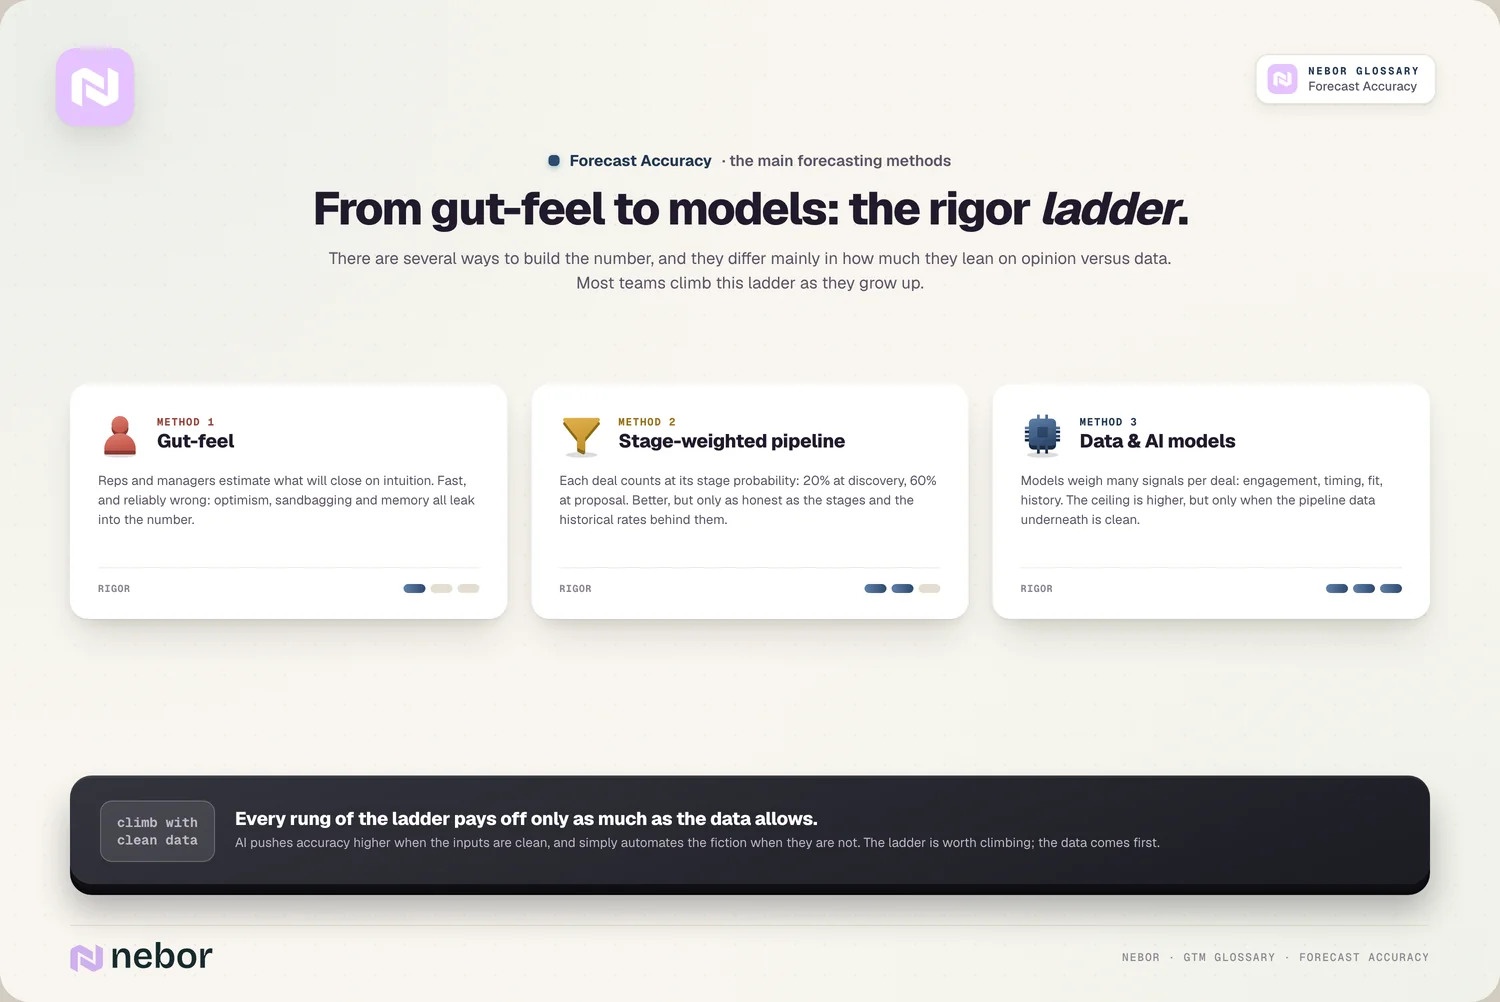
There are four common ways to produce the number, and they differ mainly in how much of it rests on someone's opinion.
A judgment roll-up is the oldest. Each rep calls their deals, the manager adjusts based on how far they trust each rep, and the totals go up the chain. It's fast and it uses context no system has, like a buyer's verbal yes on a call. It's also where optimism and sandbagging get in.
Stage-weighted pipeline multiplies each deal by a probability attached to its stage. HubSpot's pipeline settings give each deal stage a probability and calculate a weighted amount by multiplying the total in each stage by that probability. The weakness is the probabilities themselves. Defaults that say 60% at proposal mean nothing until you replace them with your own stage-to-close conversion rates, and they need checking again whenever your win rate shifts.
A category forecast takes everything in commit, adds a share of best case based on how much of it has historically closed, and ignores the rest. It's what most forecast calls run on, and it works well when reps use the categories the same way.
A model-based forecast scores each open deal against your won and lost history, using signals like stakeholder engagement, stage age and recent buyer replies. That's the territory of revenue intelligence platforms, and of the same family of models behind predictive lead scoring. Models remove a lot of the human bias. They also learn from whatever your CRM recorded, so a history full of skipped stages and fictional close dates produces confident nonsense.
Whatever the method, two quick checks catch a lot of trouble. Compare deal age with your normal sales cycle length, since a deal that's been open twice as long as usual rarely closes on the date it shows. And watch pipeline velocity week to week, because a slowdown shows up there well before it shows up in the quarter's result.
What actually tightens the gap
Teams that forecast well rarely have a cleverer method. They have better raw material. In our experience, four inputs decide most of it.
The first is stages with written exit criteria. If "Proposal" means a sent quote for one rep and a promising call for another, every method above is multiplying noise. Define what has to be true to enter and leave each stage, and make the CRM enforce the parts it can.
The second is close dates that mean something. A date that slides to the end of the month, every month, tells the forecast nothing. Require a reason when it moves, and report how often it moves per rep.
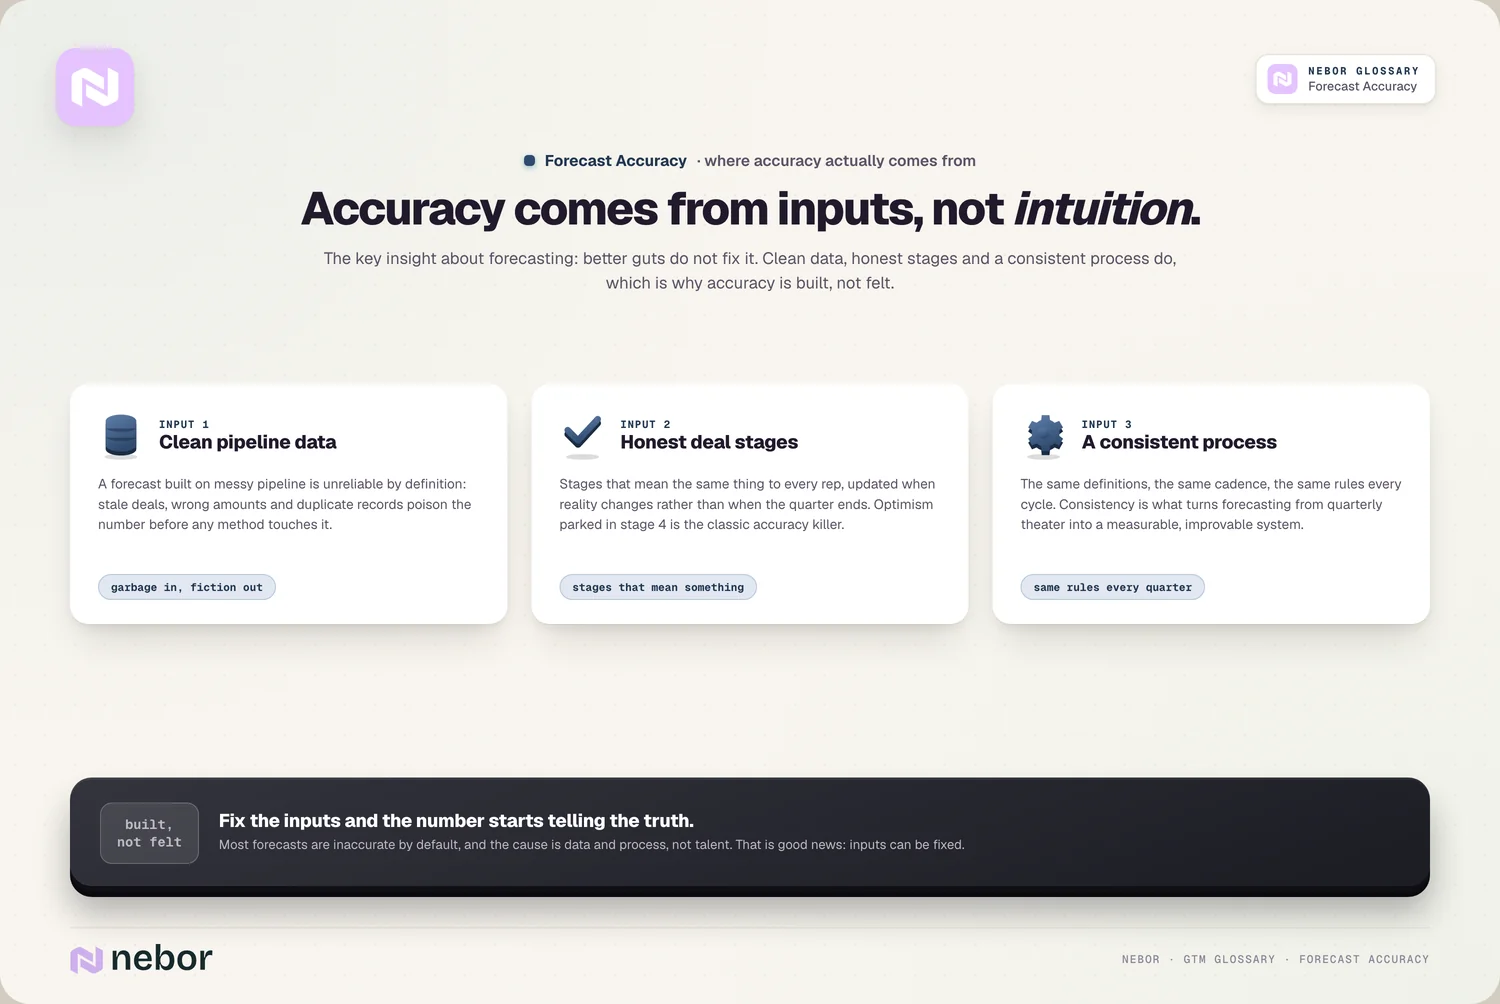
The third is the state of the records. Duplicate deals, wrong amounts and opportunities nobody has touched in months inflate the pipeline before any forecast is made, which is why CRM hygiene belongs on the forecasting checklist and not just the data team's.
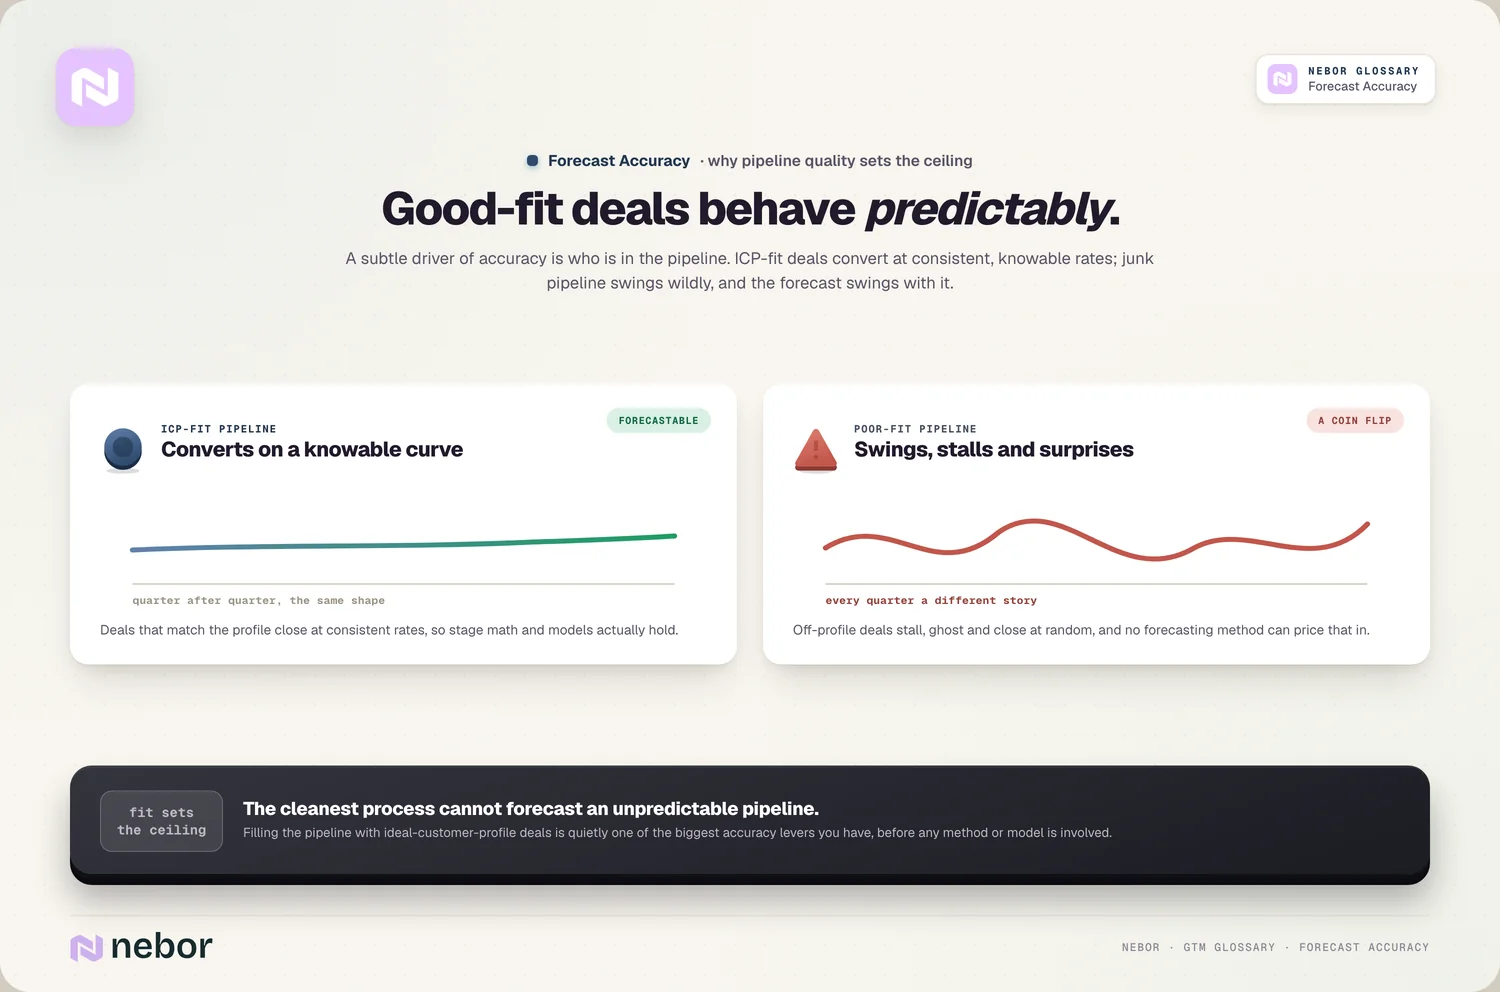
The fourth sits furthest upstream: who gets into the pipeline at all. Deals at accounts that match your ideal customer profile tend to move through the stages at steady, repeatable rates. Off-profile deals stall, go quiet and occasionally close out of nowhere, and no method can price that in. Filtering earlier, with lead scoring that weights fit properly, makes the forecast more accurate before a single deal is weighted.
For next quarter's forecast, before the deals exist, the question becomes which sources reliably produce pipeline that closes. Multi-touch attribution helps here, because it shows which channels feed deals that survive to closed won, not just which ones fill the top of the funnel.
In short
Forecast accuracy is simple to compute and easy to fake. The formula takes a minute. Agreeing on the denominator, the snapshot week, the categories in scope and how renewals are treated takes a conversation between sales and finance, and that conversation is most of the value.
Once the definition holds still, the number becomes useful. Bias shows you whether the team habitually over-calls or sandbags, the deal-level check shows whether they can read individual deals, and the trend over several quarters shows whether any of it is improving. Those readings belong to revenue operations, which owns the definitions, while the reps own the honesty of what goes in.
Better accuracy rarely comes from a smarter model. It comes from stage rules, real close dates, clean records and a pipeline full of deals that fit, which are the same things that make the rest of the revenue engine predictable. It's also a fair test of a go-to-market system as a whole, since the forecast is where everything you automate sales prospecting to create finally shows up as a number someone has to stand behind.
If you want a second pair of hands on it, Nebor sets up the stage criteria, forecast categories and accuracy reports in the CRM your reps work in every day, then hands the whole setup over with the definitions written down, so next year's numbers are measured the same way as this year's.
Frequently asked questions
What is a good forecast accuracy percentage?
There is no reliable industry standard, because teams measure different snapshots with different formulas. A sensible internal goal is to land the early-quarter commit call within about 10% of what closes, quarter after quarter, with no consistent lean in one direction. We would rather see a team stay inside that band every quarter than hit 98% once and miss by 25% the next time.
Is MAPE a good way to measure sales forecast accuracy?
MAPE, the mean absolute percentage error, works well for averaging accuracy across several quarters or segments. Its weak spot is small numbers. When actual revenue in a segment is close to zero, the percentage error explodes and drags the average with it. For individual reps and thin segments, report the miss in euros alongside the percentage, and keep a separate signed measure so bias stays visible.
Who should own forecast accuracy in a sales organization?
Revenue operations should own the definitions: the formula, the snapshot week, the categories in scope and the reports. Reps own the quality of what they enter, from stages to close dates, and sales managers own the challenge in each forecast call. Finance is the main customer of the number, so it should agree to the definitions before the first quarter is graded.
Can AI improve sales forecast accuracy?
It can, mainly by scoring each open deal against your past wins and losses and by removing some of the optimism a rep brings to their own deals. It cannot fix a pipeline with skipped stages, invented close dates or missing activity, because it learns from those records. Teams with a few years of clean history get the most out of it, and smaller teams often get further with better stage rules first.
What is sandbagging in a sales forecast?
Sandbagging is committing a forecast number you are confident of beating, so the quarter ends above the call. It protects the rep or manager but leaves finance planning on less revenue than the business is producing, which can delay hiring and spend. You spot it by tracking the signed error: a team that under-calls by a similar margin quarter after quarter is sandbagging, even if each quarter looks accurate.
What is the difference between a sales forecast and a sales quota?
A quota is a target, set before the period, for what a rep or team is expected to close. A forecast is a prediction, updated during the period, of what will actually close. The two should be kept apart. When a forecast drifts toward the quota because nobody wants to report a gap, it stops being a prediction and becomes a wish, and accuracy suffers.
What is the difference between commit and best case in a forecast?
Commit holds the deals a rep is confident will close in the period and is willing to be held to. Best case adds deals that could close if things go well but carry real doubt. A common way to build the forecast is to take all of commit plus the share of best case that has historically closed, which is why both categories need consistent definitions across reps.
Why is my weighted pipeline forecast always too high?
Usually because the stage probabilities are defaults or guesses, not your own conversion rates, and because old deals are still sitting in late stages with outdated close dates. Replace each stage probability with the share of deals that historically closed from that stage, and close out deals that have been open far longer than your normal sales cycle. Both changes tend to bring the weighted number down to earth.
Does forecast accuracy matter for a small sales team?
Yes, often more than for a large one, because a small company has less cash to absorb a miss. With only a handful of deals per quarter, though, percentages swing wildly, so judge accuracy over several quarters and look at deal-level calls. Knowing which of the five deals in commit really closed tells a small team more than a percentage based on five deals.
Share this post
RevOps
Glossary
Related glossary items
Understanding the core GTM concepts




Ready to build your pipeline