
In this post:
Win rate is the share of decided deals that you won: deals won divided by deals won plus deals lost, for the same period. Close 12 deals and lose 28, and your win rate is 30%.
It's the metric that tells you whether a missed target is a supply problem or a conversion problem. When a quarter goes badly, the reflex is to ask for more leads. Say you work 100 opportunities at a 20% win rate and land 20 deals. Getting to 30 takes 150 opportunities at the same rate, or the same 100 at 30%. The second route costs no extra pipeline, no extra rep hours and no extra ad spend.
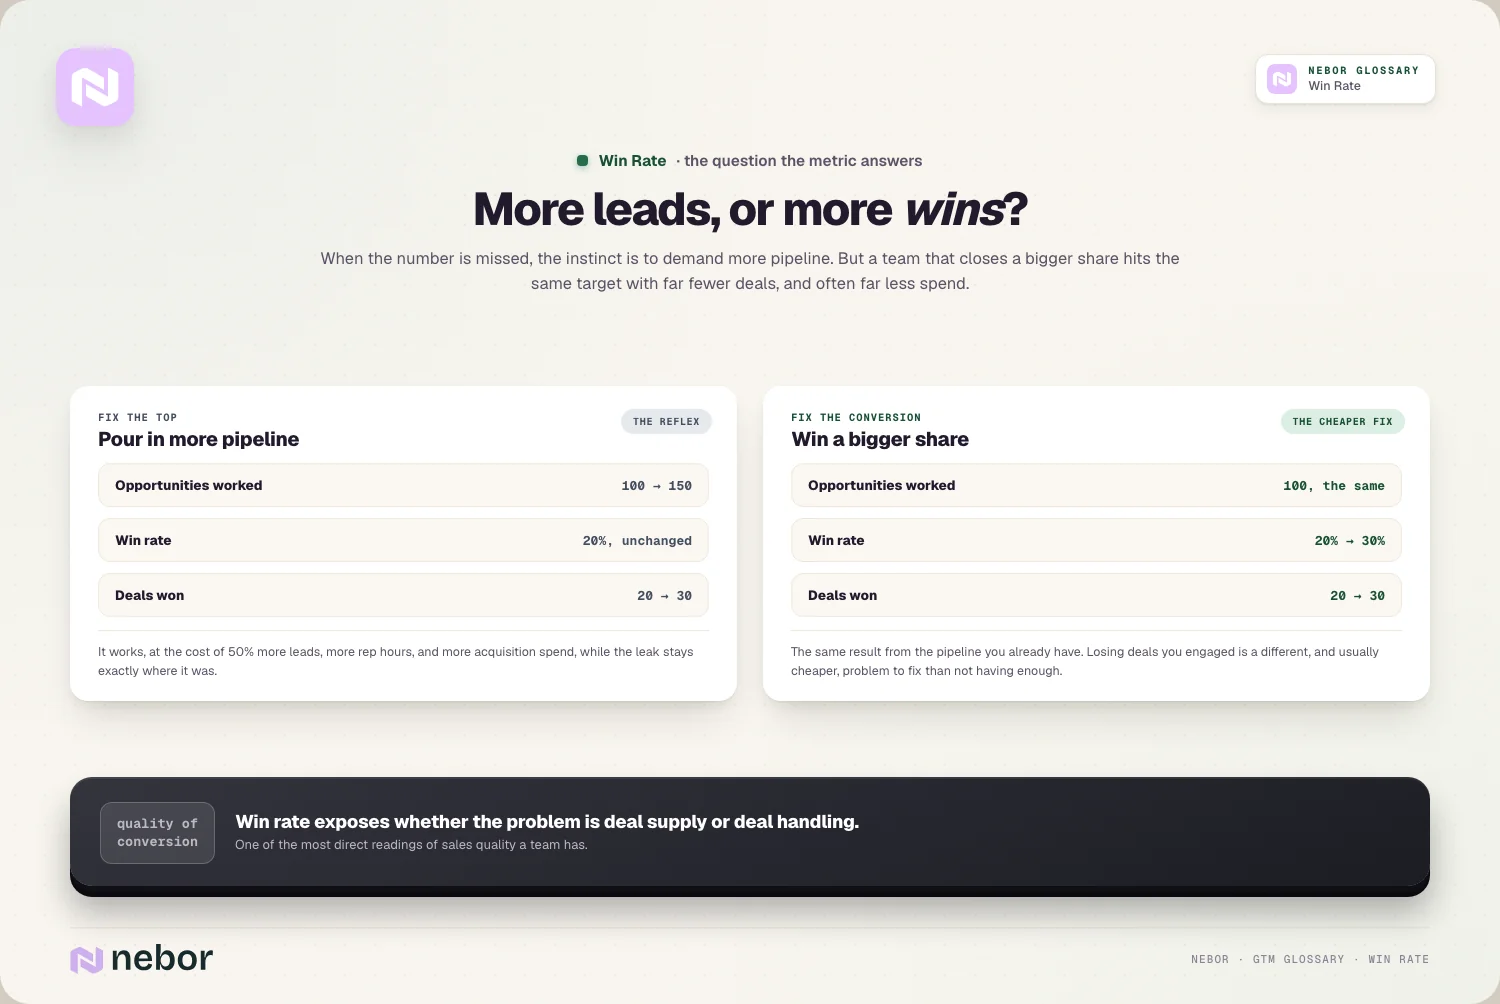
The catch is that "win rate" isn't one number. Every team decides which deals go into the denominator, often without realizing it's a decision, and those choices can move the figure by ten points. Two companies quoting a 25% win rate may be measuring completely different things. Most of what follows is about making those choices on purpose.
TL;DR
The formula is won ÷ (won + lost) × 100, counting only deals that reached a verdict in the period. Open deals stay out until they close.
Four choices shape the denominator: whether no-decision deals count as losses, which stage turns a deal into an opportunity, whether you group deals by close date or created date, and whether you count deals or their value. Write yours down and don't change it mid-year.
Treat published benchmarks with suspicion. Most come from vendor surveys that don't say how they counted stalled deals, so your own last four quarters, measured the same way, are a better yardstick.
In HubSpot or Salesforce, make a lost reason required, add "no decision" as one of the options, and close out deals that have sat open for more than twice your average sales cycle. Ebsta found those had a 3% chance of closing.
Qualification moves win rate more than closing technique. Working fewer, better-fit deals, multi-threading early and keeping deals moving all lift it.
Read it by rep, source and segment, but pool enough deals first. With 15 decided deals in a quarter, one deal swings the rate by almost seven points.
How to calculate win rate
The win rate formula is short:
Win rate = deals won ÷ (deals won + deals lost) × 100
Only deals that reached a verdict in the period count. If 12 deals closed won and 28 closed lost this quarter, the win rate is 12 ÷ 40, or 30%. The deals still open don't count yet, because nobody knows how they'll end. When they close, they join whichever quarter they closed in.
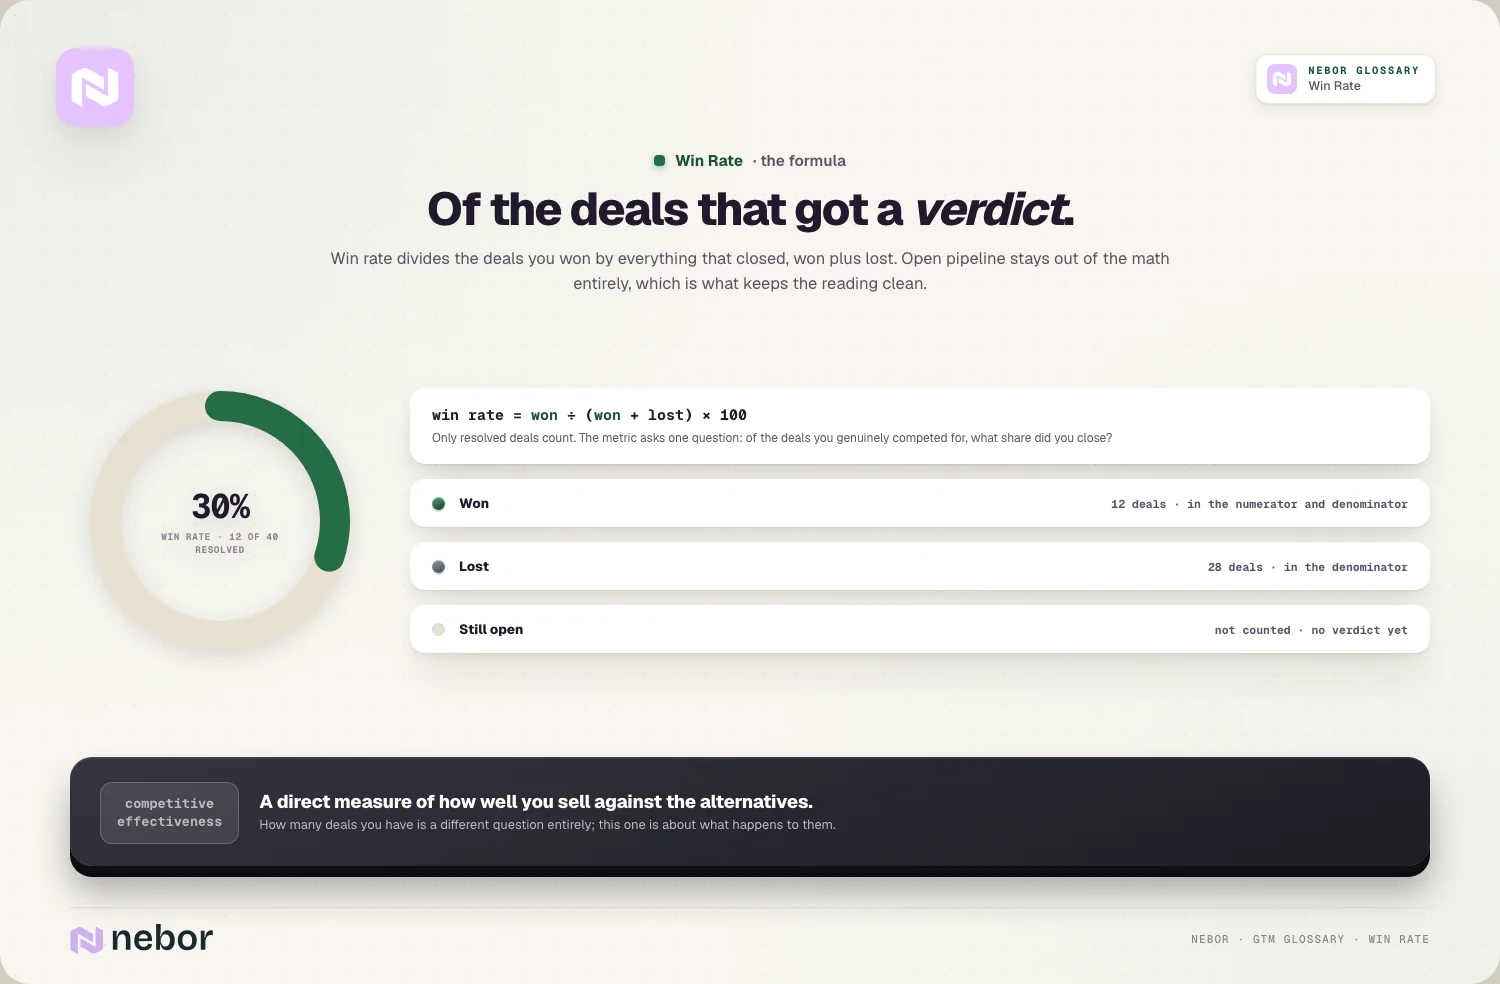
Leaving open deals out is what keeps the number clean. It measures how well you compete for the deals you actually pursued to an end, and nothing else. How many deals you have is a separate question, answered by pipeline metrics.
That simplicity is also why the number gets misread. The formula looks settled, but the words "won" and "lost" hide several judgment calls, and the next section is about those.
Who gets counted: the choices inside the denominator
Before you compare a win rate with anything, including last year's, you need to know how these four questions were answered.
Do no-decision deals count as losses?
Plenty of deals don't end with a rival winning or a clear no. The buyer goes quiet, the project gets shelved and the status quo wins. Matthew Dixon and Ted McKenna built The JOLT Effect on a study of more than two and a half million sales conversations, and its subject is exactly this: buyers who mean to buy and then don't decide.
Where you put those deals changes the number a lot. Take a quarter with 9 deals won, 21 lost and 10 that just stopped.
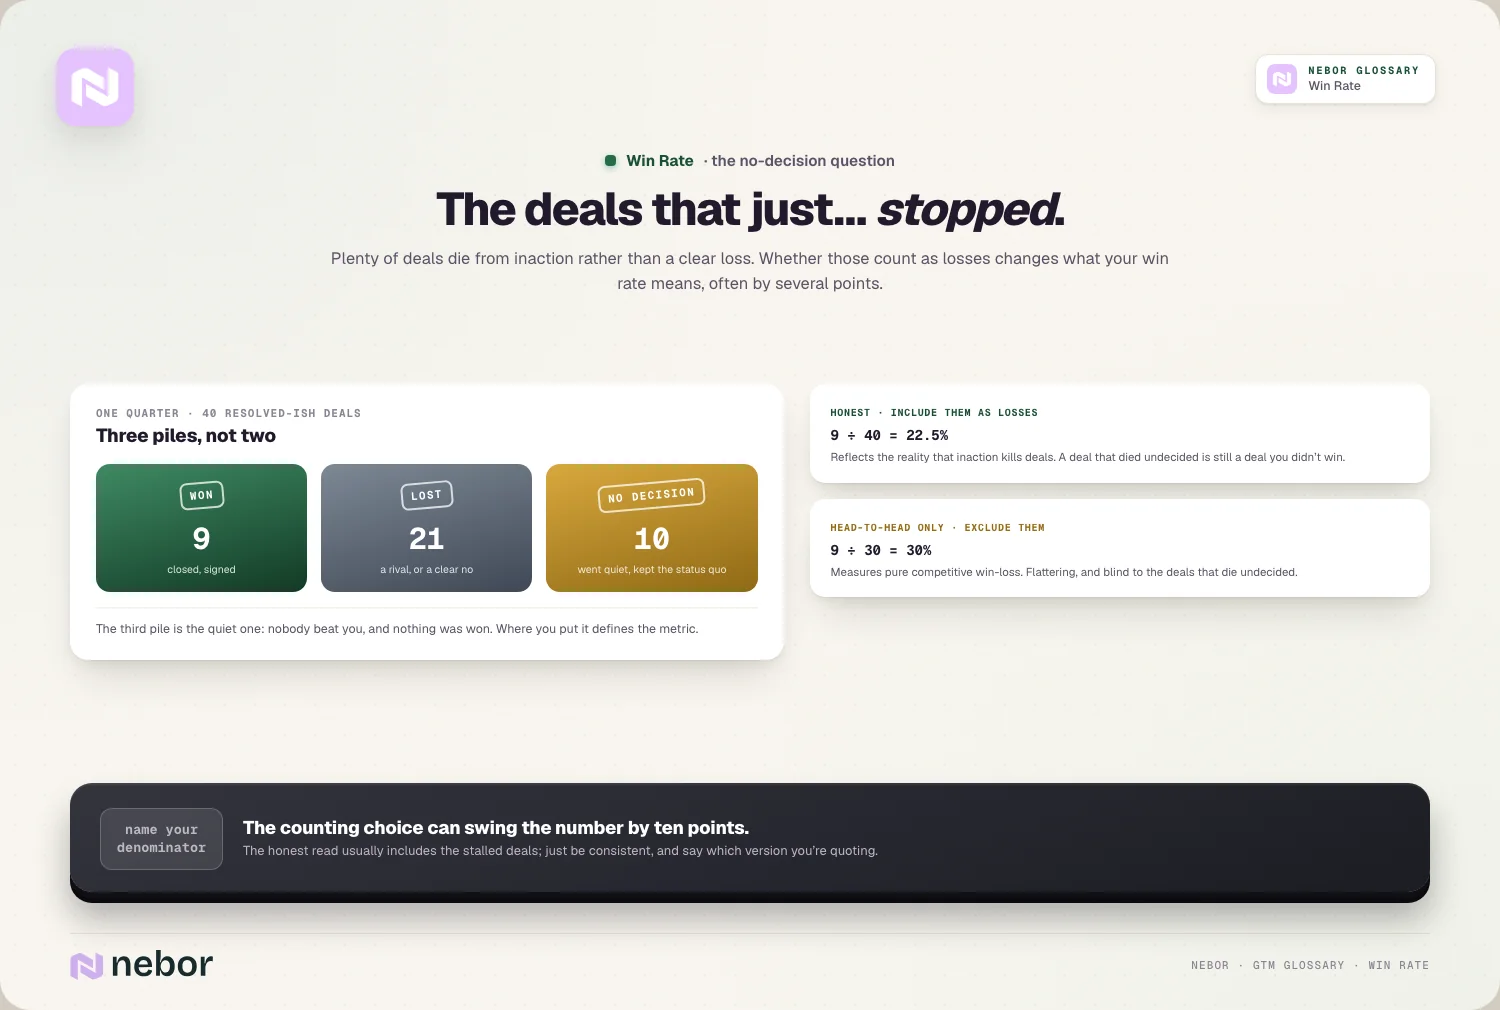
Count the stalled deals as losses and you get 9 ÷ 40, or 22.5%. Leave them out and you get 9 ÷ 30, or 30%. Same quarter, same team, a 7.5-point gap.
We count no-decision deals as losses in the headline number, because a deal that died undecided is still a deal you didn't win, and it still cost rep time. Then we report the head-to-head version next to it. If the gap between the two keeps widening, your problem is buyers not deciding, which calls for a different fix from losing to a competitor.
When does a deal start counting?
Win rate depends heavily on how early a deal becomes an opportunity in the CRM. If reps create one after every first call, the denominator fills with deals that were never real and the rate looks poor. If they only create one after a successful demo, the rate looks great and hides everything lost before that point.
Pick one entry point, usually the moment a deal passes your lead qualification criteria, and measure from there. If you also want to see early losses, track a separate rate from first meeting to qualified opportunity.
Close date or created date?
The quick way is to take every deal that closed this quarter, won or lost. It's easy to pull, but it mixes deals created last week with deals that dragged on for a year.
The cleaner way is a cohort: take every opportunity created in a given quarter and wait until nearly all of them have closed. That shows how a specific batch of pipeline performed, which is better for judging a campaign or a new segment. The cost is waiting roughly one sales cycle before the number settles.
Deals or euros?
A count-based win rate treats a €5k deal and a €300k deal the same. A value-based one weights them by amount, so one big loss can sink the quarter's figure. Count-based is better for judging how reps sell, and value-based is the one to use for pipeline planning. Label which one you're quoting, because they can differ by a lot.
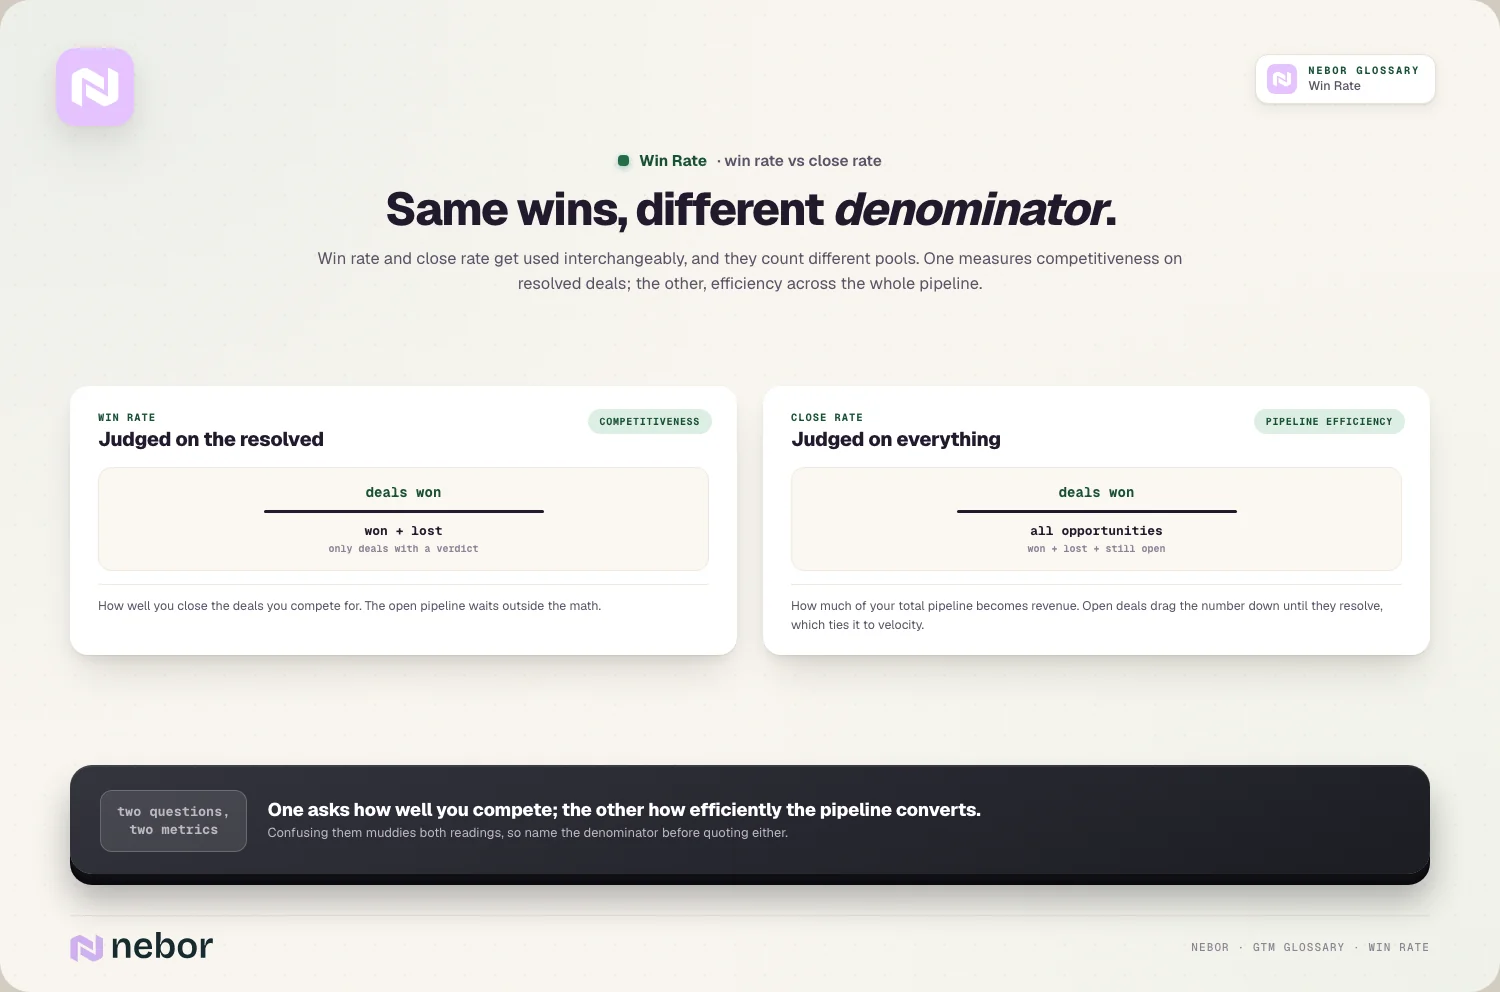
Here's how the common versions compare, including close rate, the metric win rate gets confused with most often.
Metric | Denominator | What it tells you |
|---|---|---|
Win rate (headline) | Won + lost, with no-decision deals counted as lost | How often a qualified deal you worked to an end turned into a customer |
Head-to-head win rate | Won + deals lost to a competitor or a clear no | How well you compete when the buyer actually chooses |
Competitive win rate | Deals where a named competitor was involved | Your record against one specific rival |
Value win rate | Amount won + amount lost | How much of the money you competed for you captured |
Close rate | All opportunities in the period, including those still open | How much of the whole pipeline turns into revenue, which ties it to speed |
Win rate benchmarks, and why we don't lean on them
Search for an average B2B win rate and you'll find confident figures, often broken out by deal size and industry. Most of them come from vendor blogs quoting vendor surveys, and very few say how the denominator was built. After the last section, you can see why that matters. A survey that excludes no-decision deals will report a higher "average" than one that includes them, before any difference in sales skill.
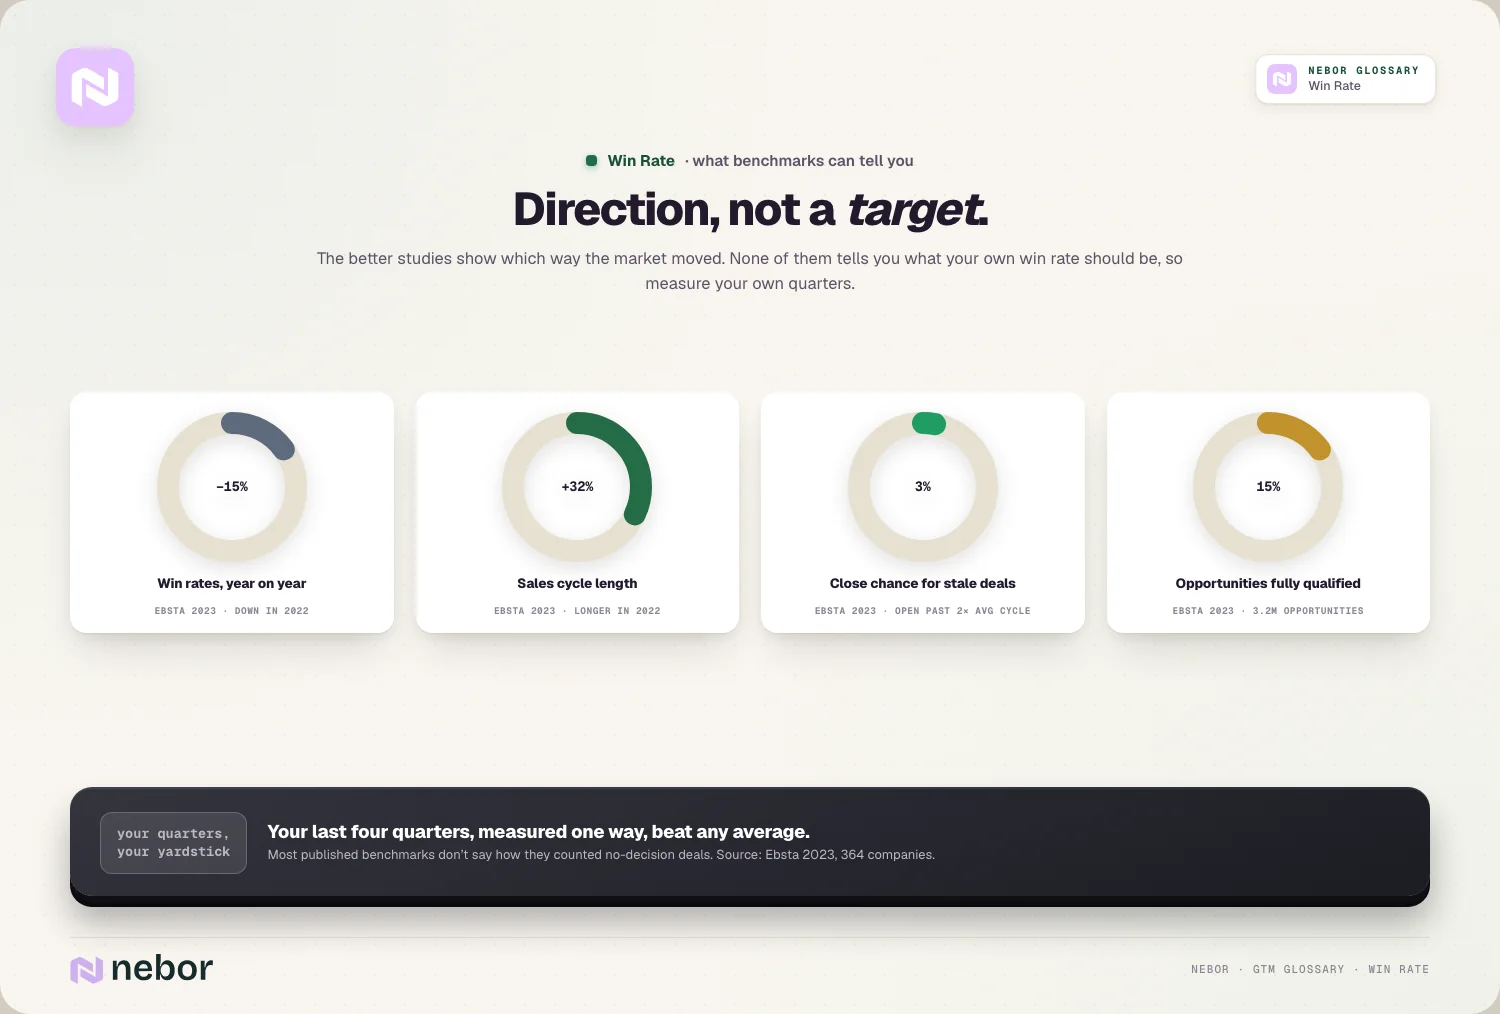
The better studies are useful for direction rather than for a target. Ebsta's 2023 B2B Sales Benchmark Report analyzed 3.2 million opportunities from 364 companies and found win rates fell 15% year over year in 2022 while sales cycles got 32% longer. That tells you the market got harder. It doesn't tell you what your number should be.
If someone hands you a benchmark, ask three questions before you use it: were no-decision deals counted as losses, at which stage did a deal enter the count, and was it measured by number of deals or by value? If the source can't answer, treat the figure as decoration. The benchmark that holds up is your own last four quarters, measured with the same definition, and split by deal size so a few large deals don't skew it.
Tracking win rate in HubSpot and Salesforce
Both CRMs already know which deals are won and lost. HubSpot sets its default deal properties "Is Closed Won" and "Is closed lost" automatically from the stage, and Salesforce marks each opportunity stage as closed, won or neither. Salesforce's Einstein guide even tells admins to keep the standard Stage field, because it's what Einstein uses to calculate win rates. A basic won ÷ (won + lost) report is a few minutes' work in either.
The reporting is the easy part. What makes the number trustworthy is how deals get closed out.
Make the lost reason required. HubSpot has a "Closed lost reason" property for this, and Salesforce lets you add one. Without it you know you lost, but not why.
Add "no decision" as a reason. That single option lets you report the headline and head-to-head win rates from the same data.
Close out stale deals. Deals that sit open forever hide losses and flatter the rate. In Ebsta's data, opportunities open longer than twice the average sales cycle had just a 3% chance of closing, so we flag anything past that point for the owner to close or justify.
Log the competitor. A competitor field on the deal is what makes a competitive win rate possible later.
What raises a win rate
When win rate drops, teams usually reach for closing training. In our experience the bigger lever sits much earlier, in which deals get worked at all. A deal that was never a good fit rarely gets won however well it's sold, and every one of them sits in the denominator.
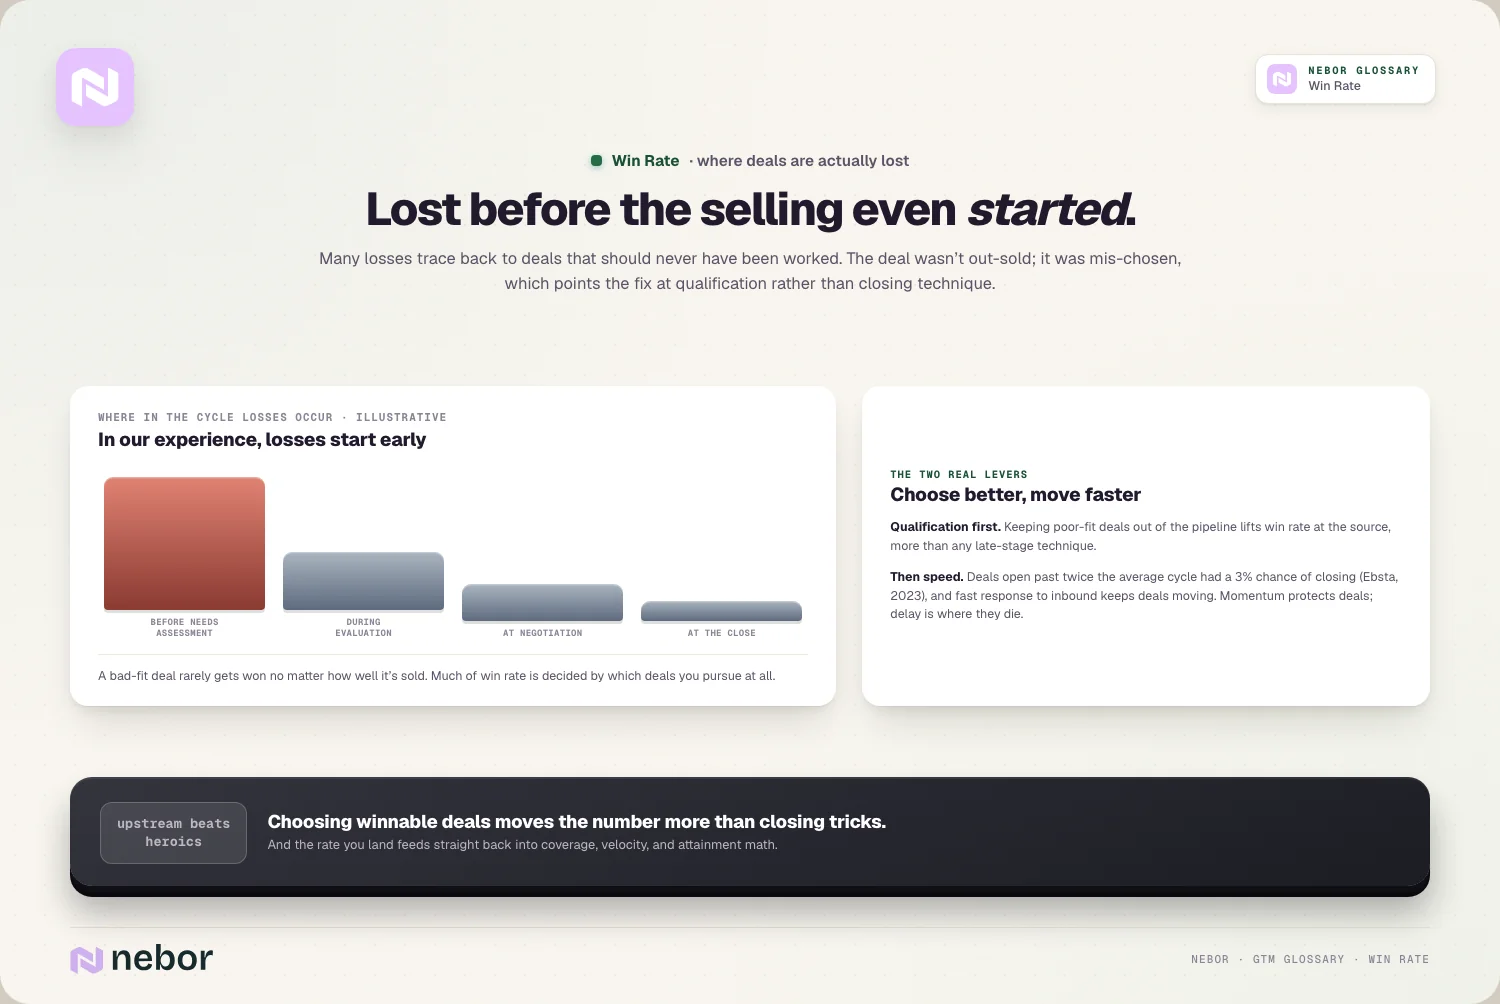
So start with fit. Deals at accounts that match your ideal customer profile win more often, and a qualification framework like MEDDPICC helps only if reps actually fill it in. Ebsta's report found that although 61% of companies adopting a sales methodology chose MEDDPICC, just 15% of opportunities were fully qualified.
Next comes breadth. A deal resting on one contact is fragile, because that person can leave, lose the argument internally or simply go quiet. Multi-threading early, so several people in the buying group know you, protects deals from exactly the no-decision outcome described above.
Then speed. Responding fast to inbound interest is the heart of speed to lead, and keeping deals moving matters as much once they're open. Deals that stall tend to die, which is why win rate and pipeline velocity usually move together.
Execution still counts on the deals you do fight for. A good-fit deal can still drift away on a concern the rep never surfaced, and solid objection handling is what keeps it moving toward a yes.
Slicing the number by rep, source and quarter
A company-wide win rate is a summary. Split it and it starts to explain things. By rep, it shows who needs coaching and on what. By lead source, it shows which channels produce deals you can actually win, which is often a different list from the channels producing the most deals. By segment or deal size, it stops you judging an enterprise team against a small-business number. By stage of loss, it shows whether deals die early, in qualification, or late, in negotiation.
Watch the sample sizes, though. A rep with 15 decided deals in a quarter moves almost seven points with every single deal, so a jump from 27% to 40% may be two lucky closes. Pool two or three quarters before drawing conclusions about individuals, and treat any segment with fewer than about 20 decided deals as a hint rather than a finding.
Win rate also drives your planning math. The value-based version sets how much pipeline coverage you need: at a 25% win rate, you need roughly four times the remaining target in qualified pipeline. It's one of the four inputs to sales velocity (opportunities × average deal size × win rate ÷ cycle length), and it feeds straight into quota attainment. It's also the last step of your wider pipeline conversion rate, so a poor win rate sometimes starts with weak conversion several stages earlier.
Wrapping up
Win rate looks like the simplest metric in sales, and the arithmetic is simple. The hard part is agreeing what counts: which deals entered the race, how a stalled deal is scored, which period it belongs to, and whether a big deal weighs more than a small one. Settle those once, write them down and keep them stable, and the number becomes comparable from quarter to quarter.
Once it's comparable, it mostly tells you about your choices. Teams that qualify hard, bring in more than one contact early and close out dead deals honestly see their win rate climb, often without changing a word of their pitch. Teams that chase every opportunity fill the denominator with deals they had little chance of winning.
That's why a better win rate is usually the cheapest growth available in a go-to-market system. It gets more revenue out of the pipeline you already pay for, including everything you automate sales prospecting to generate.
If you want help with the plumbing, Nebor sets up the stages, required lost reasons and win rate reports on your existing deal pipeline, and hands them over with the definitions documented, so the number means the same thing next year.
Frequently asked questions
Is win rate the same as close rate?
No, although many teams use the terms interchangeably. Win rate divides deals won by deals that reached a verdict, won plus lost. Close rate divides deals won by all opportunities in the period, including the ones still open. Win rate tells you how well you compete for deals you work to an end, while close rate tells you how much of the whole pipeline turns into revenue. Always say which one you are quoting.
What is a good win rate in B2B sales?
There is no reliable universal figure, because published averages rarely say whether no-decision deals were counted or at which stage a deal entered the count. A good win rate is one that is stable or rising against your own previous quarters, measured the same way, and compared within the same deal size and segment. Enterprise deals with large buying committees will naturally sit lower than small, fast transactions.
What is the difference between win rate and win/loss ratio?
Win rate is wins as a share of all decided deals, so 12 won and 28 lost gives 30%. Win/loss ratio compares wins directly with losses, so the same quarter gives 12 to 28, or about 0.43. Both use the same data, but win rate is easier to read and plug into planning math, which is why most sales teams report it instead of the ratio.
How does win rate relate to pipeline conversion rate?
Win rate covers only the last step of the funnel, where a qualified deal is won or lost. Pipeline conversion rate tracks how leads and deals move through every stage before that. A low win rate can start much earlier, with poor-fit leads entering the funnel, so read the two together to see whether the problem is in how you close or in what you let into the pipeline.
Can a win rate be too high?
Yes. A very high win rate often means reps only create opportunities once a deal is nearly certain, so early losses never get recorded. It can also mean the team is too cautious, chasing only easy deals and leaving winnable larger ones alone. If your win rate is far above your own history, check when deals are being created and whether revenue is growing along with it.
Why did our win rate go up when our pipeline went down?
Usually because the deals that disappeared were the weakest ones. When a team tightens qualification, cuts a poor channel or stops creating opportunities after every first call, the denominator shrinks faster than the number of wins. That is often a healthy change. It becomes a problem only if total wins and revenue fall too, which means good deals were cut along with the bad ones.
Does responding faster to leads improve win rate?
Generally, yes. A fast reply reaches the buyer while the problem is still top of mind and before a competitor sets the terms of the conversation. Slow follow-up lets interest fade, and many of those deals end without any decision at all. Speed also matters after the first call, because deals that keep moving through their stages are far more likely to close than deals that sit idle for weeks.
Should renewals and upsells count in your win rate?
Keep them separate. Renewals and expansion deals with existing customers close at very different rates from new business, so mixing them in makes the new business number look better than it is. Report a new business win rate as the main figure, and track expansion and renewal rates on their own. Most CRMs let you do this with a deal type field or a separate pipeline.
How do you calculate win rate in a spreadsheet?
Export your closed deals with their stage, close date and lost reason. Count the deals marked won in the period, then count the deals marked won or lost in the same period, and divide the first by the second. In Excel or Google Sheets, COUNTIFS on the stage and close date columns does both counts. Add a filter on lost reason to produce the head-to-head version without no-decision deals.
How much does objection handling affect win rate?
It matters most on deals that are a good fit. Poor-fit deals rarely get rescued by handling objections well, but a well-qualified deal can still drift away on a concern about price, risk or effort that the rep never surfaced. Listening for those concerns on calls and answering them directly keeps good deals moving toward a decision instead of fading into a no-decision loss.
Share this post
RevOps
Glossary
Related glossary items
Understanding the core GTM concepts




Ready to build your pipeline