

Google's free dashboard builder, renamed Data Studio in April 2026, that connects to BigQuery, Sheets, Ads and Analytics and turns them into shareable reports and embeds.
What is
Looker Studio
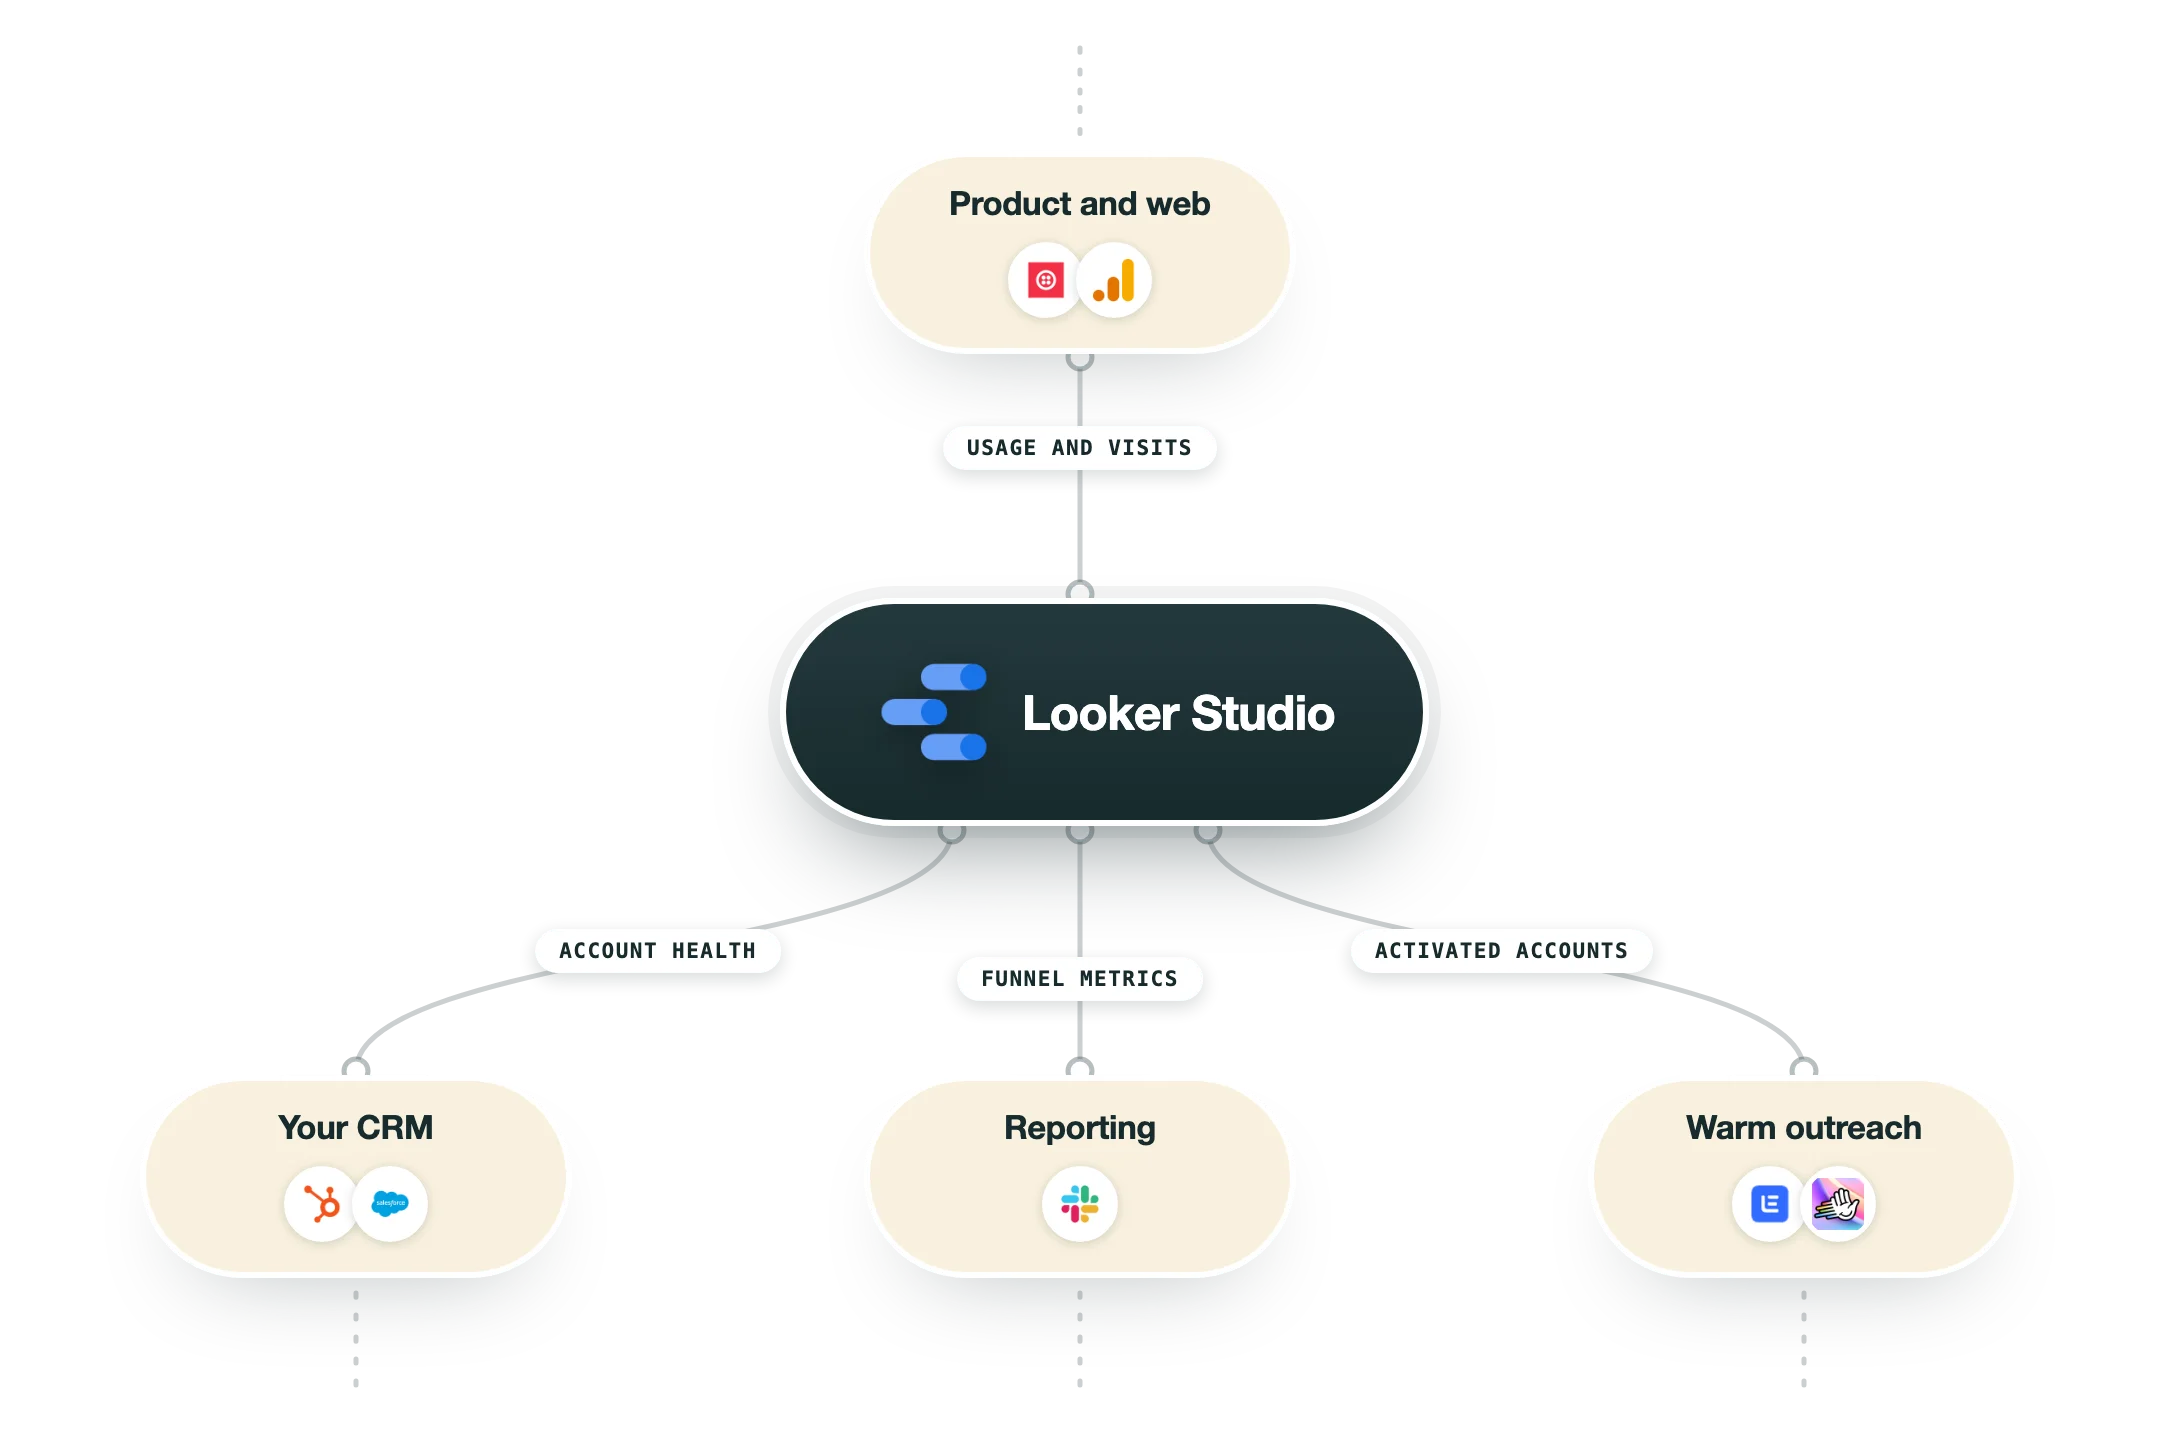
Google puts more than 1,400 data sources behind Looker Studio and charges nothing for the tool itself, and that pairing is how it became the reporting layer on so many GTM stacks. You drag charts onto a canvas, point them at GA4, Google Ads, Sheets or BigQuery, and share the result as a link or an embed. In April 2026 Google renamed it back to Data Studio, the name it carried until 2022, and drew a line between the two products. Looker keeps the governed semantic model for enterprise BI, while Data Studio is pitched at personal exploration, ad hoc reports and a home for BigQuery agents and Colab data apps. The connections arrive in three shapes, starting with Google's free connectors for Ads, Analytics, Search Console, BigQuery and Sheets. Over 1,300 community connectors cover everything outside Google, and direct database connections reach Postgres, MySQL, Redshift or Spanner. Joins happen inside a blend that holds five tables at most. Looker Studio is the right reporting layer once the modelling happens somewhere else, because a free viewer over a clean BigQuery table is hard to argue with. Ask it to model the data as well and the five table ceiling stops you. Nebor has no client running it, and Understory's published stack puts it in that slot.
Integrations and the modern GTM stack
Looker Studio reaches Google's own products for free and reaches everything else through a connector somebody outside Google built and charges for. Plan tier barely matters here, since almost every connection works on the free version, so the question worth asking is who maintains the pipe and what they bill you for it.
BigQuery | The pairing Google tunes for, with refresh options from every 1 minute to every 12 hours, custom SQL as a data source, and BI Engine to accelerate a slow report. Google warns that normal BigQuery query costs apply on every refresh, including the automatic ones, so a heavily viewed dashboard has a bill behind it. |
Google Ads, Analytics, Search Console and Campaign Manager 360 | Free native connectors covering the Google marketing stack, plus Display & Video 360, Search Ads 360 and YouTube Analytics. All of them refresh on a fixed twelve hour cycle that cannot be shortened, and the Analytics connector inherits Google Analytics sampling without showing that the numbers are sampled. |
Google Sheets | Refreshes as often as every 15 minutes and acts as the universal fallback for anything with no connector of its own. Most GTM data lands here first, whether it is a Clay table export, a CRM report or a sequencer download, which leaves Sheets holding up more of these dashboards than anyone plans for. |
Databases and cloud storage | Direct connections to Cloud SQL, MySQL, PostgreSQL, SQL Server, Amazon Redshift, Spanner and Cloud Storage, all with refresh windows from 1 to 50 minutes or 1 to 12 hours. This is the route to use when your warehouse already holds the modelled tables. |
Community connectors | Over 1,300 connectors built on Apps Script by third parties, which is how HubSpot, Salesforce, LinkedIn Ads, Meta, Stripe and the rest get in. Supermetrics, Porter Metrics, Windsor.ai and Dataslayer are the usual vendors, each with their own subscription, their own rate limits and their own support desk. |
Looker | The Looker connector pulls governed Explores from a Looker instance into a Data Studio report, which is Google's bridge between the semantic model and the free canvas. Google publishes a page of requirements, limits and unsupported features for it, so check that list before promising a client parity with their Looker dashboards. |
Clay and outbound tooling | Nothing native exists for Clay, Instantly, Smartlead or HeyReach. The workable routes are a Clay export into Google Sheets, or writing send and reply data into BigQuery through n8n and reporting off the warehouse table. Expect to build that pipe yourself before outbound numbers can sit on the same page as ad spend. |
What is missing | Google builds no connector for HubSpot, Salesforce, LinkedIn Ads or Meta, so the CRM and paid social half of your reporting depends on a vendor or your own pipeline. Row level control is limited to filtering a data source by the viewer's email address, and nothing writes back to the source system. |
Pro’s
The tool costs nothing for creators and for viewers, so a client dashboard gets stood up and shared with fifteen people without a seat conversation or a procurement step.
Google's own connectors cover BigQuery, Sheets, Google Ads, Analytics, Search Console and Campaign Manager 360 at no charge, so the Google half of your reporting needs no paid middleman.
Over a modelled BigQuery table it holds up well, and BI Engine plus extracted data sources give you two documented routes to make a slow report faster.
Sharing runs on Google account permissions, link sharing and embedding into any page, so a client opens the report without another login for someone to administer.
Pro ties report ownership to a Google Cloud project, so the dashboards keep working after the person who built them leaves, which is the failure every agency eventually hits.
Cons
Google Ads, Analytics, Search Console, Campaign Manager 360 and YouTube Analytics refresh every twelve hours and Google states that rate cannot be changed, so a dashboard that reads as live can be half a day behind the account.
Google's own documentation says the product does not indicate when Analytics data is sampled, so a report can put a sampled number in front of a client with nothing on screen to flag it.
A blend holds five tables at most and the modelling stops at calculated fields, so Google now pitches the product for personal exploration and ad hoc reports while Looker keeps the semantic layer.
The data extract Google recommends for slow reports fails above 100 MB and truncates anything past 750,000 rows, so the official speed fix has a ceiling you meet on any real dataset.
Most of the 1,300 community connectors are third party and billed separately, with Porter Metrics from $15 per account per month and Supermetrics from 49 euros a month, so the free tool usually arrives with a paid dependency attached.
Pricing
Data Studio
$0/month No charge for report creators or report viewers, no credit card and no seat count
Connect to more than 1,400 data sources
Free Google connectors for BigQuery, Sheets, Ads, Analytics and Search Console
Unlimited reports, blends of up to five tables and calculated fields
Link sharing, scheduled email delivery and embedding
Community connector gallery and report template gallery
Data Studio Pro
$9/user/project/month Billed monthly per licence inside one Google Cloud project, viewers of Pro content need no licence
Team workspaces with Manager, Content Manager and Contributor roles
Report ownership held by a Google Cloud project rather than a person
Up to 200 delivery schedules per report plus delivery to Google Chat
Personal report links and chart based alerts
Gemini assistance and Conversational Analytics on BigQuery data
CMEK, customer managed storage, data residency and Looker mobile app access
Access to Google Cloud Customer Care, which needs its own support plan
Explorer Package
How it fits your stack
Alternatives


At a glance
Free for report creators and viewers
More than 1,400 connectable data sources
Over 1,300 community connectors
Native BigQuery, Sheets, Ads and GA4 links
Blends join up to five tables
Report embedding and link sharing
Pro adds team workspaces and project ownership
Gemini and BigQuery conversational agents
Read some of our client stories
GTM Workflows
Learn how to use GTM tools in workflows
Guides and tutorials to get the most from your workflows










Ready to get started?




By clicking Sign Up you're confirming that you agree with our Terms and Conditions.