
How to Build Your TAM (Total Addressable Market) for B2B Sales and Go-to-Market in 2026


In this post:
Your TAM is the total demand that exists in the market for what you sell, the full revenue opportunity if every potential buyer bought. And the short answer to building one is to define your ICP first, map accounts against it from multiple data sources into Clay (or your CRM), tier them by fit, and validate with buying signals.
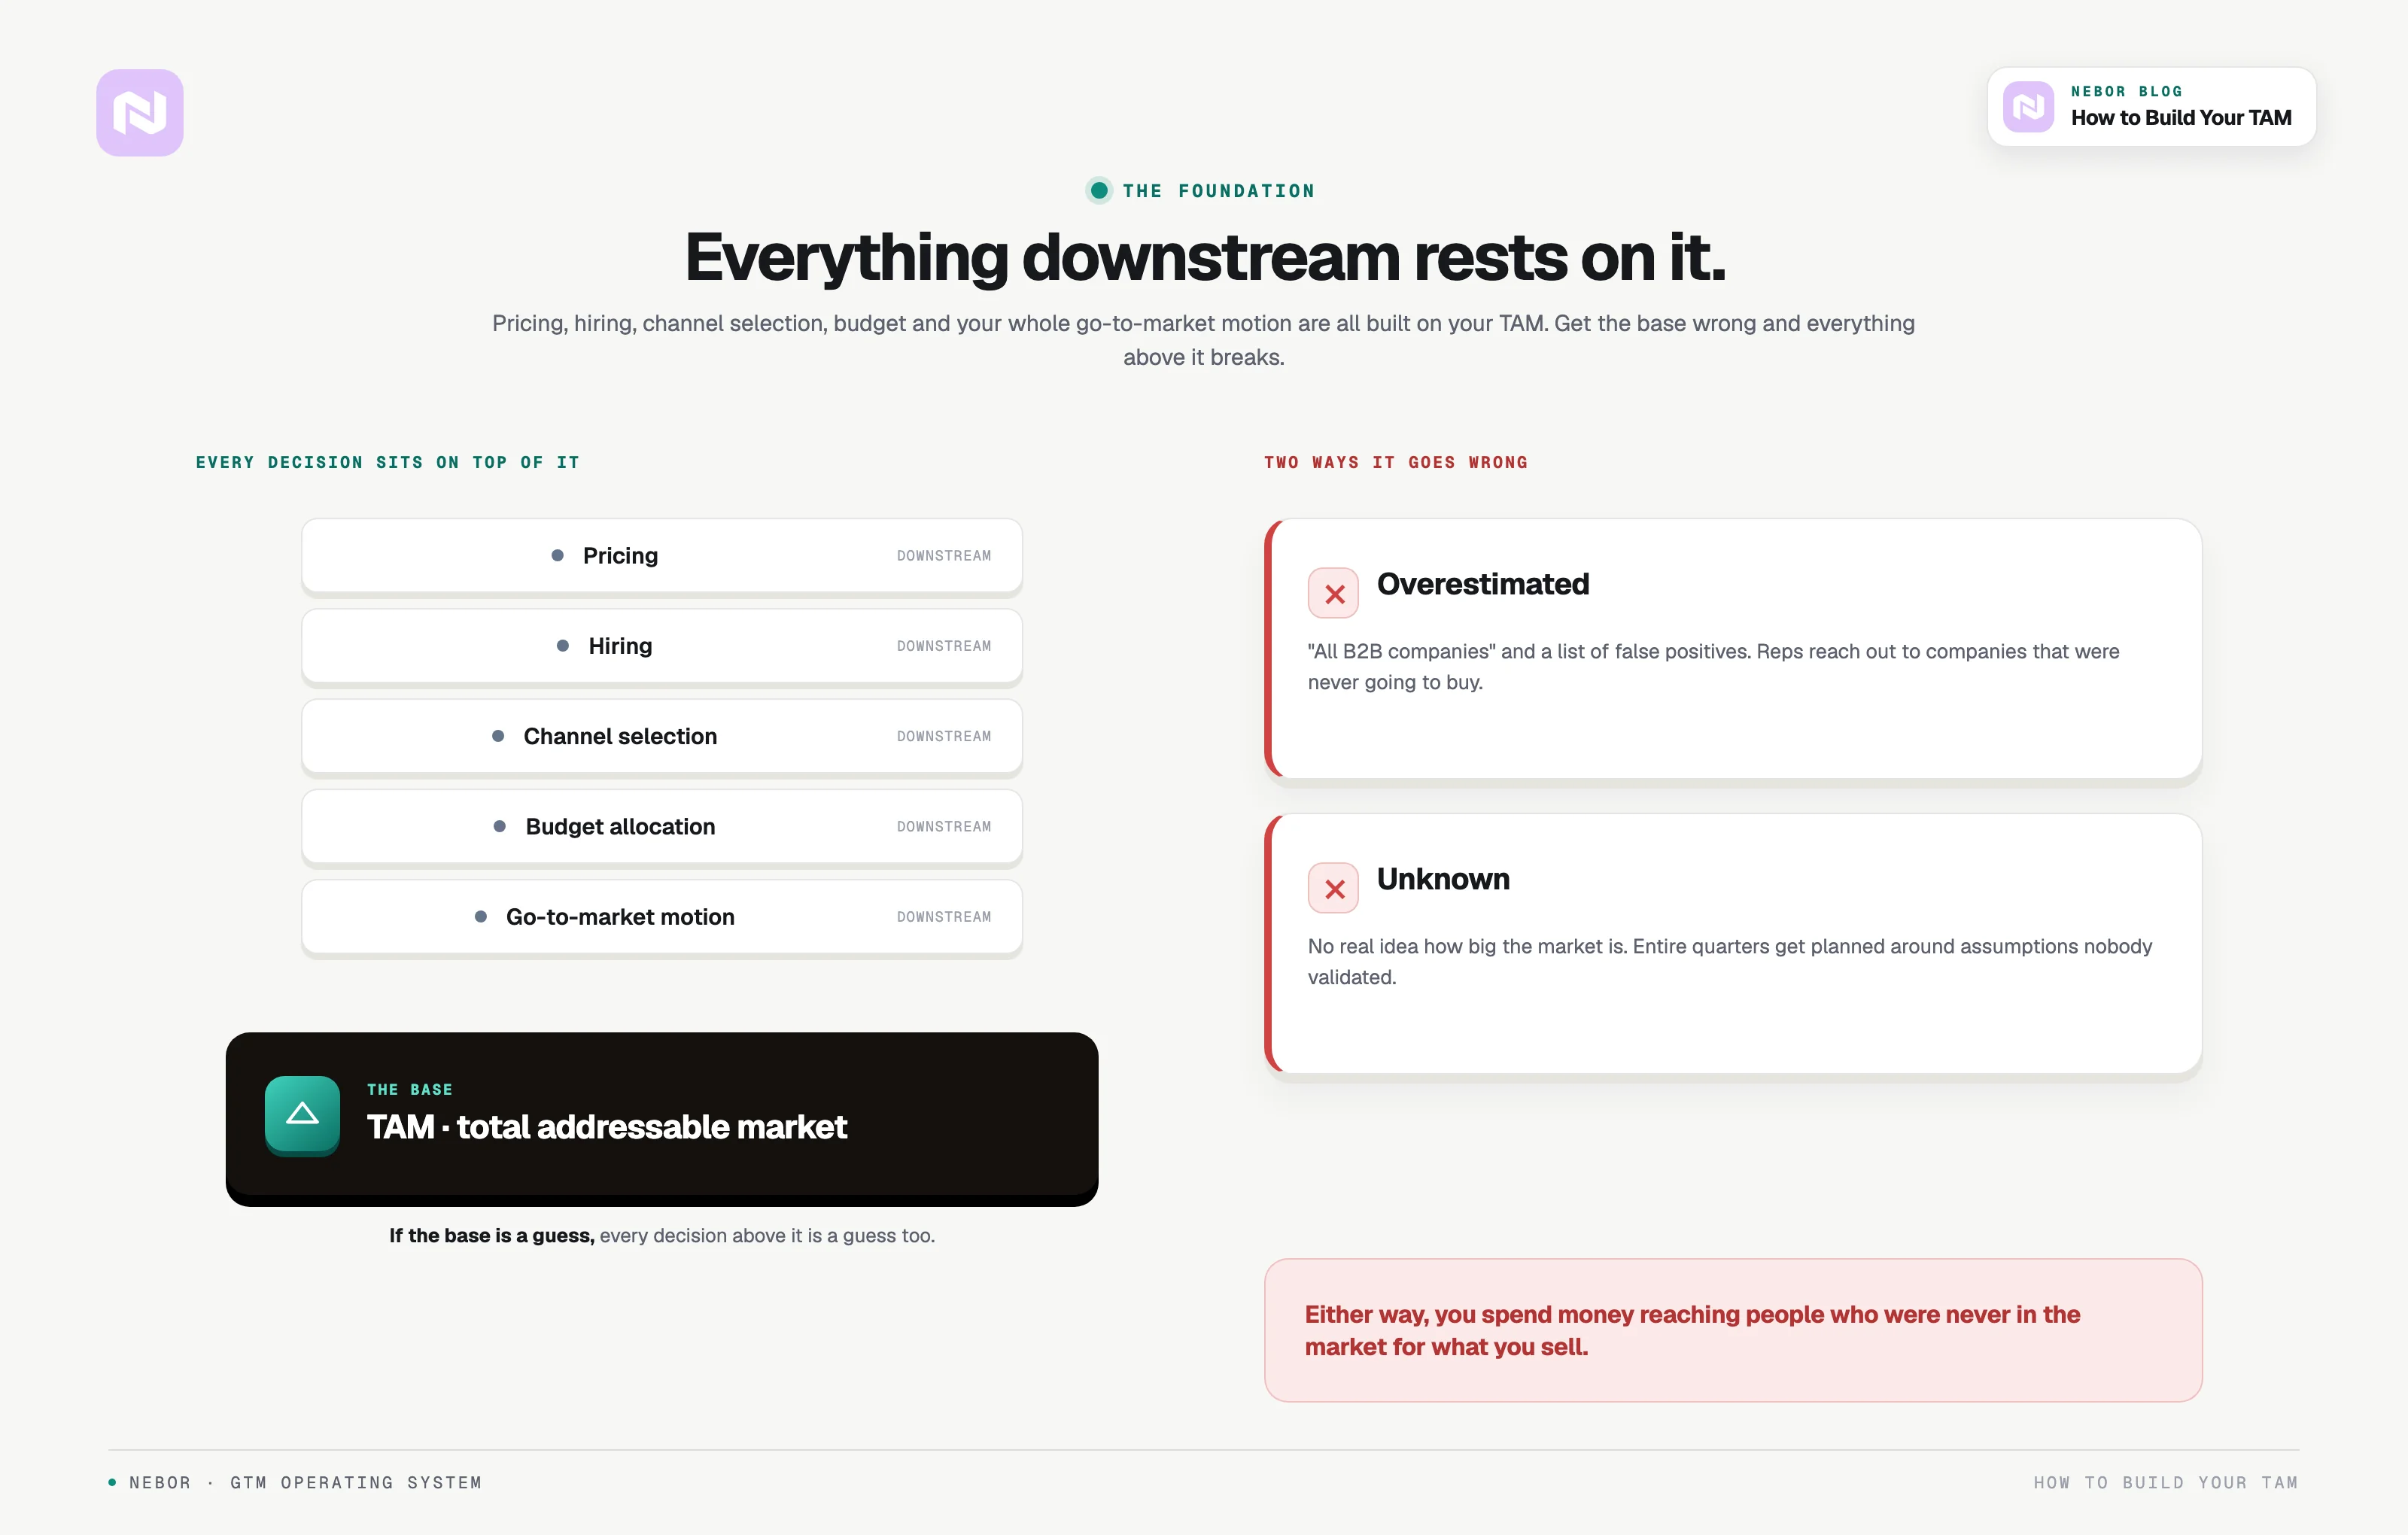
The problem is that Most B2B companies either have their total addressable market (TAM) way bigger than it is (companies love false positives) or they genuinely have no idea how big their addressable market is. Both are a problem. And it shows up in execution.
Your sales reps go after companies that were never going to buy, marketing budgets go to customer segments that don't convert, and entire quarters get planned around assumptions about potential customers that nobody validated.
Your TAM is the foundation for every strategic decision: pricing, hiring, budget allocation, and what go-to-market motion you use. If you nail it, your budget focuses on your most promising customer segments instead of on sales efforts toward people who were never in the market for what you sell.
You can build this yourself, and this post gives you the full process for it. It's also the exact system we build for clients at Nebor when they'd rather have their entire market mapped, scored, and living in Clay and the CRM, with fresh accounts flowing in as they start to fit.
Here is what we will cover: how to calculate a TAM (top down, bottom up, and value theory), the market evaluation framework, and the full mapping process.
TL;DR
Here is a quick glance at what your total addressable market (TAM) should APPROXIMATELY look like. Approximately, because when narrowed down, your business specifics are always unique and end up shaping the workflow you should build.
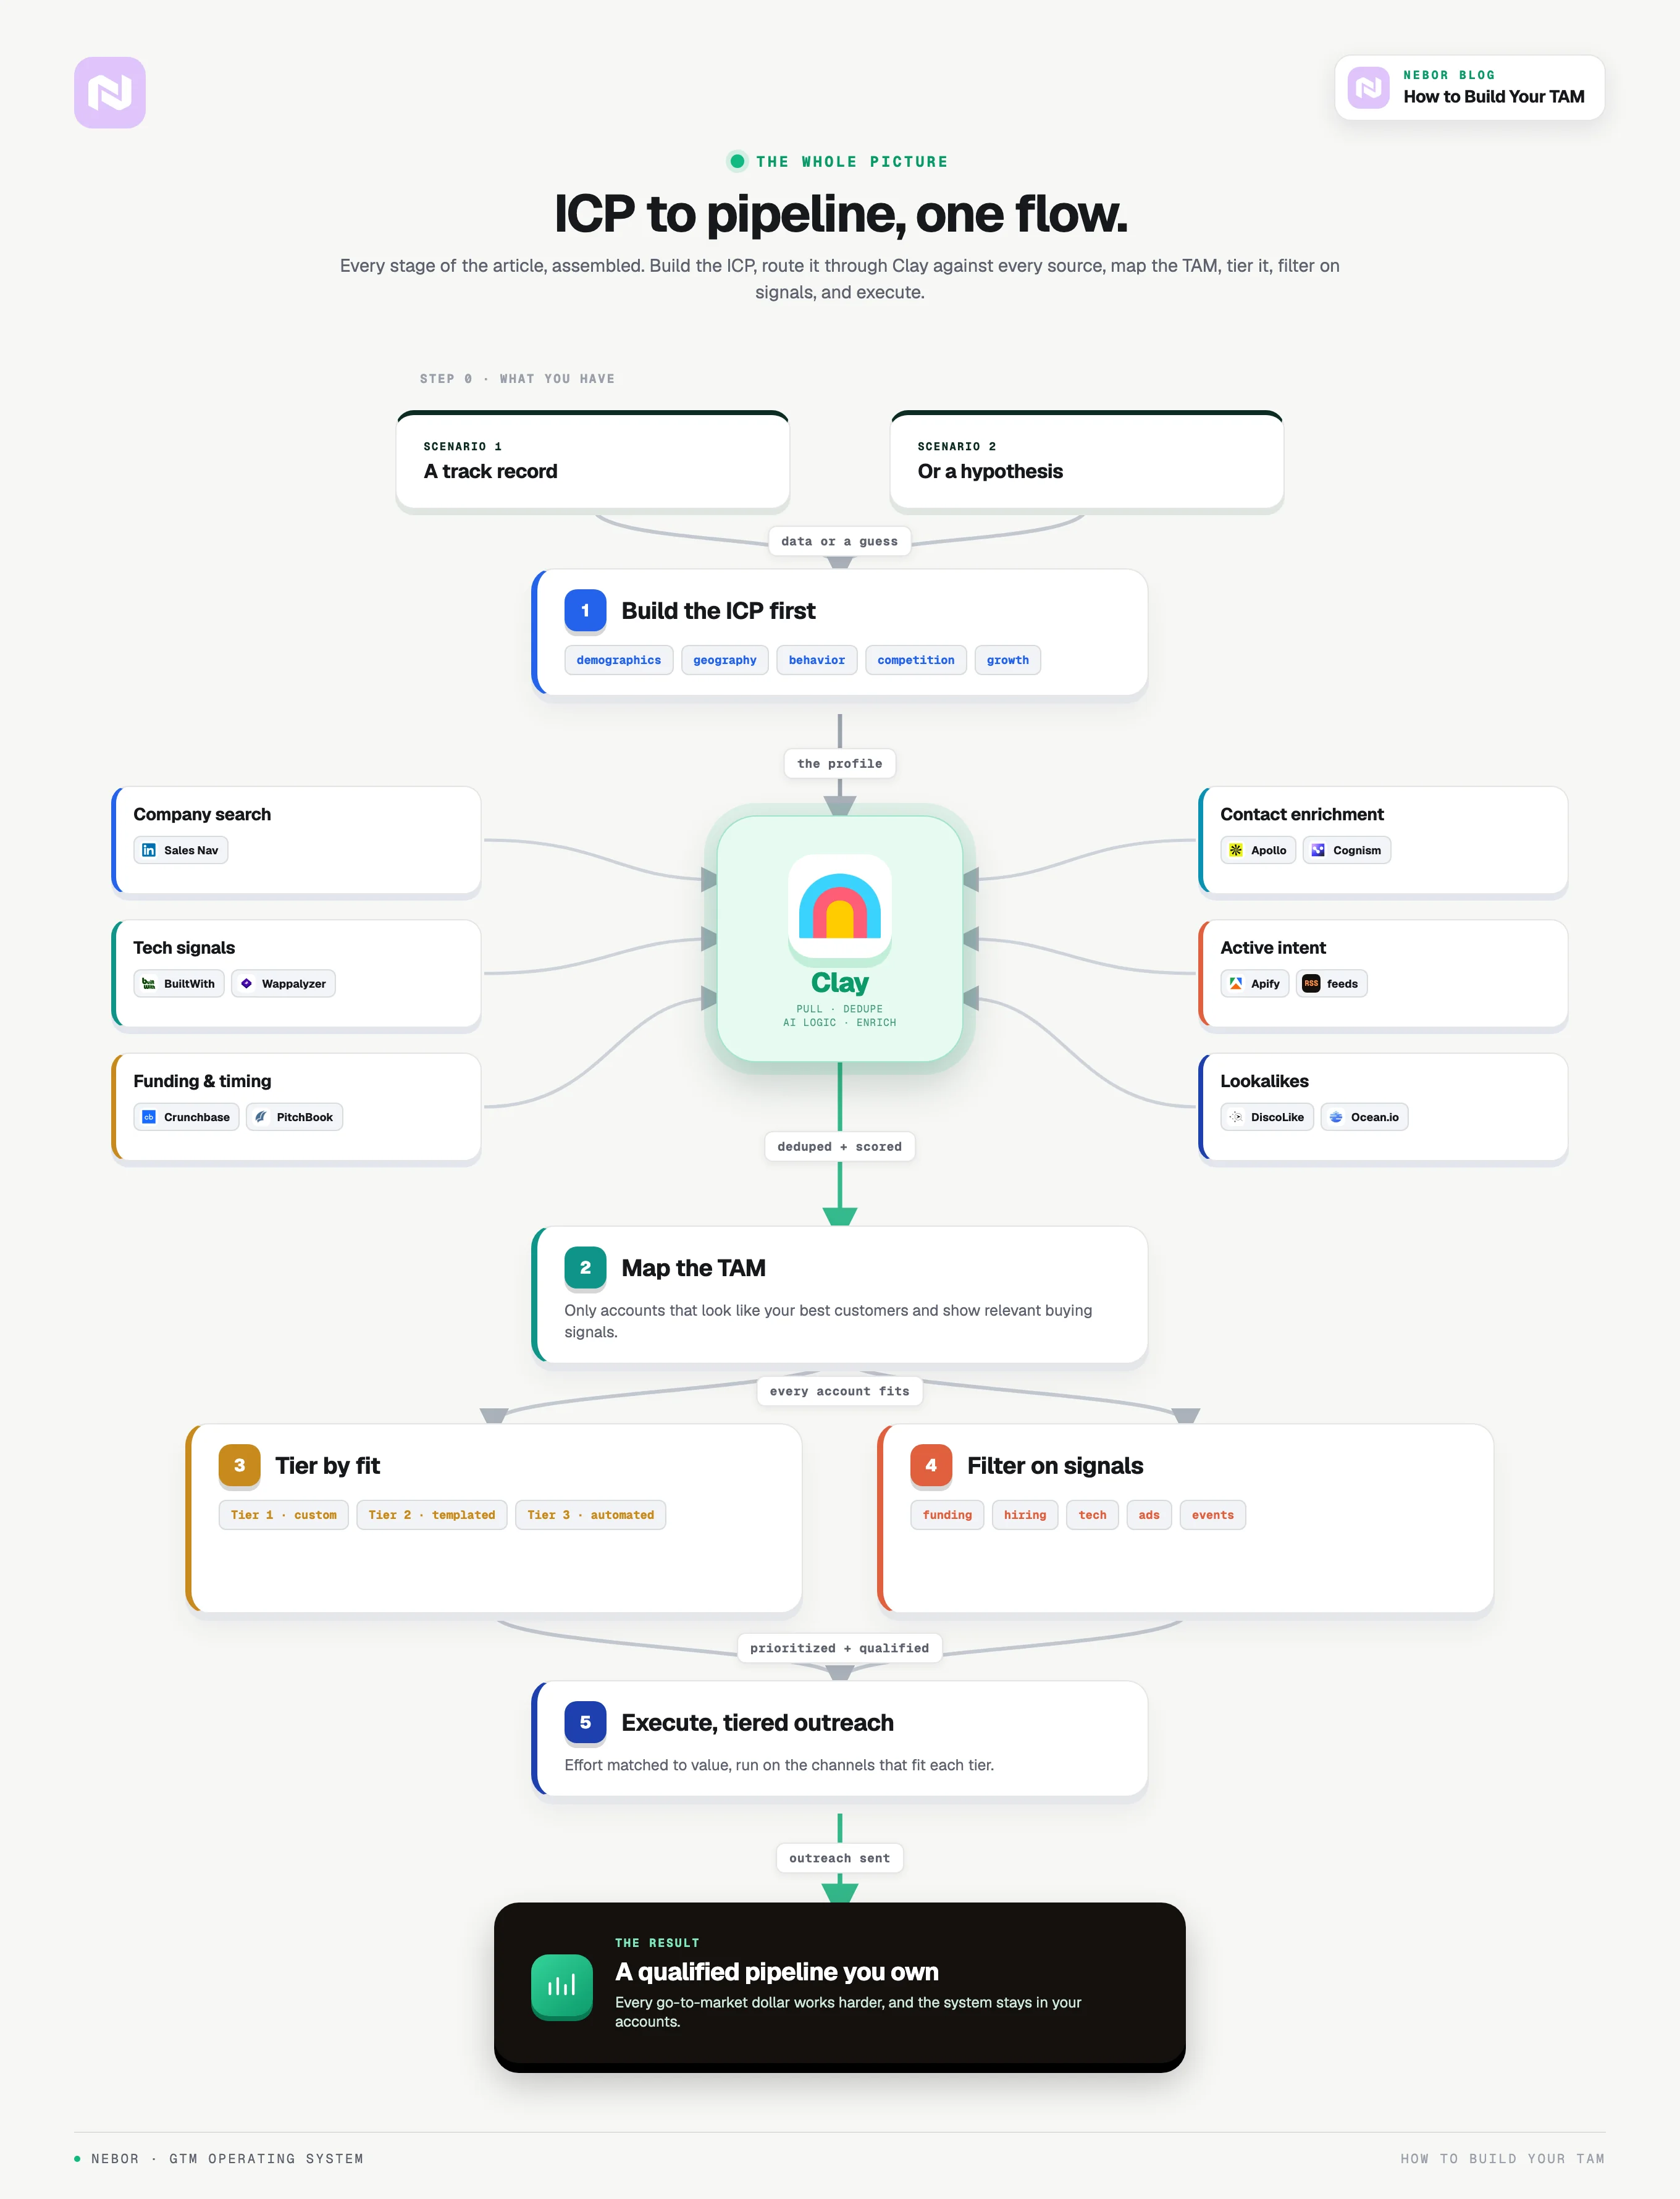
Building this is a service we provide at Nebor: we map the total addressable market with you, wire the data sources into Clay, and turn the result into a qualified pipeline you own. This is a general representation of that workflow. Click, zoom, and see how it all comes together.
If you'd rather have it built than build it, book a 15-minute call and we'll scope it for your business.
How do you calculate your total addressable market (TAM)?
A good TAM does two jobs. It shows investors, employees, and other key stakeholders what your business could become, and it keeps your own business strategy tied to a real market size instead of a wish. It also helps you see what happens to your market share when you raise prices or when a new competitor enters your specific market.
There are three common ways to calculate TAM. Each one reads the market size, market potential, and revenue potential a little differently, and in practice you'll end up mixing them.
The TAM formula (bottom up approach)
The formula itself is simple: TAM = total number of potential customers × average revenue per customer. You count everyone who could buy, you multiply by the average price they'd pay per year (in most B2B pricing, that's the annual contract value), and that's the monetary value of the whole market and the potential revenue in it.
We prefer the bottom up approach, and it's the one we use for clients. It builds the TAM calculation from first-party data: your current customers, your real pricing, and account counts you can check yourself. A bottom up analysis like that gives you a market size you can defend, and that matters once there's budget attached to the number.
The top down approach
The top down approach starts from the whole pie. You take estimates from analyst firms, industry reports, and macroeconomic or population data, you size a specific market segment and the potential market behind it, and you assume a market share of it. Analysts calculate total addressable market this way when there's little time for market research.
A beverage company, for example, might take the total drinks market from published market data and narrow it down to its sub market by region and category. Filings from publicly traded companies help too, because they show real revenue for a particular company in your space.
The top down method is fine for a first pass, but it flatters you. Market trends and market growth numbers from a report don't tell you how much of that market size your company's products can really reach. Treat it as a ceiling and nothing more.
The value theory approach
Value theory asks two questions: how much value do customers get from your product, and how much of that value would they pay for? It works best for a new market, untapped markets, or any business venture where no industry research exists yet, because the business idea itself changes what buyers would pay. To calculate TAM this way, you put a price on the value you deliver and multiply it across the target population.
However you calculate total addressable market, the number is only the start. The rest of this post is about turning it into a target market you can actually sell to, and that's where business success is decided.
Start with clear analysis goals before you even touch a spreadsheet
Before you gather data, define what you are actually trying to understand. You'd be surprised how many teams skip this and end up with a giant spreadsheet of international markets and potential revenue figures that tell them nothing useful.
Are you doing this for market size assessment? ICP refinement? Territory planning? A comprehensive business plan for next quarter? Investor decks? Each goal means different market data, needs different market research, and produces different outputs for your target market.
A TAM exercise for fundraising paints the potential scale of the business opportunity, and the market size you claim there will be quoted back to you. One for territory planning has to be realistic so reps can hit quota. Both have value, but they are not the same exercise, so get clear on purpose first.
The 5-step market evaluation framework that gives you clarity
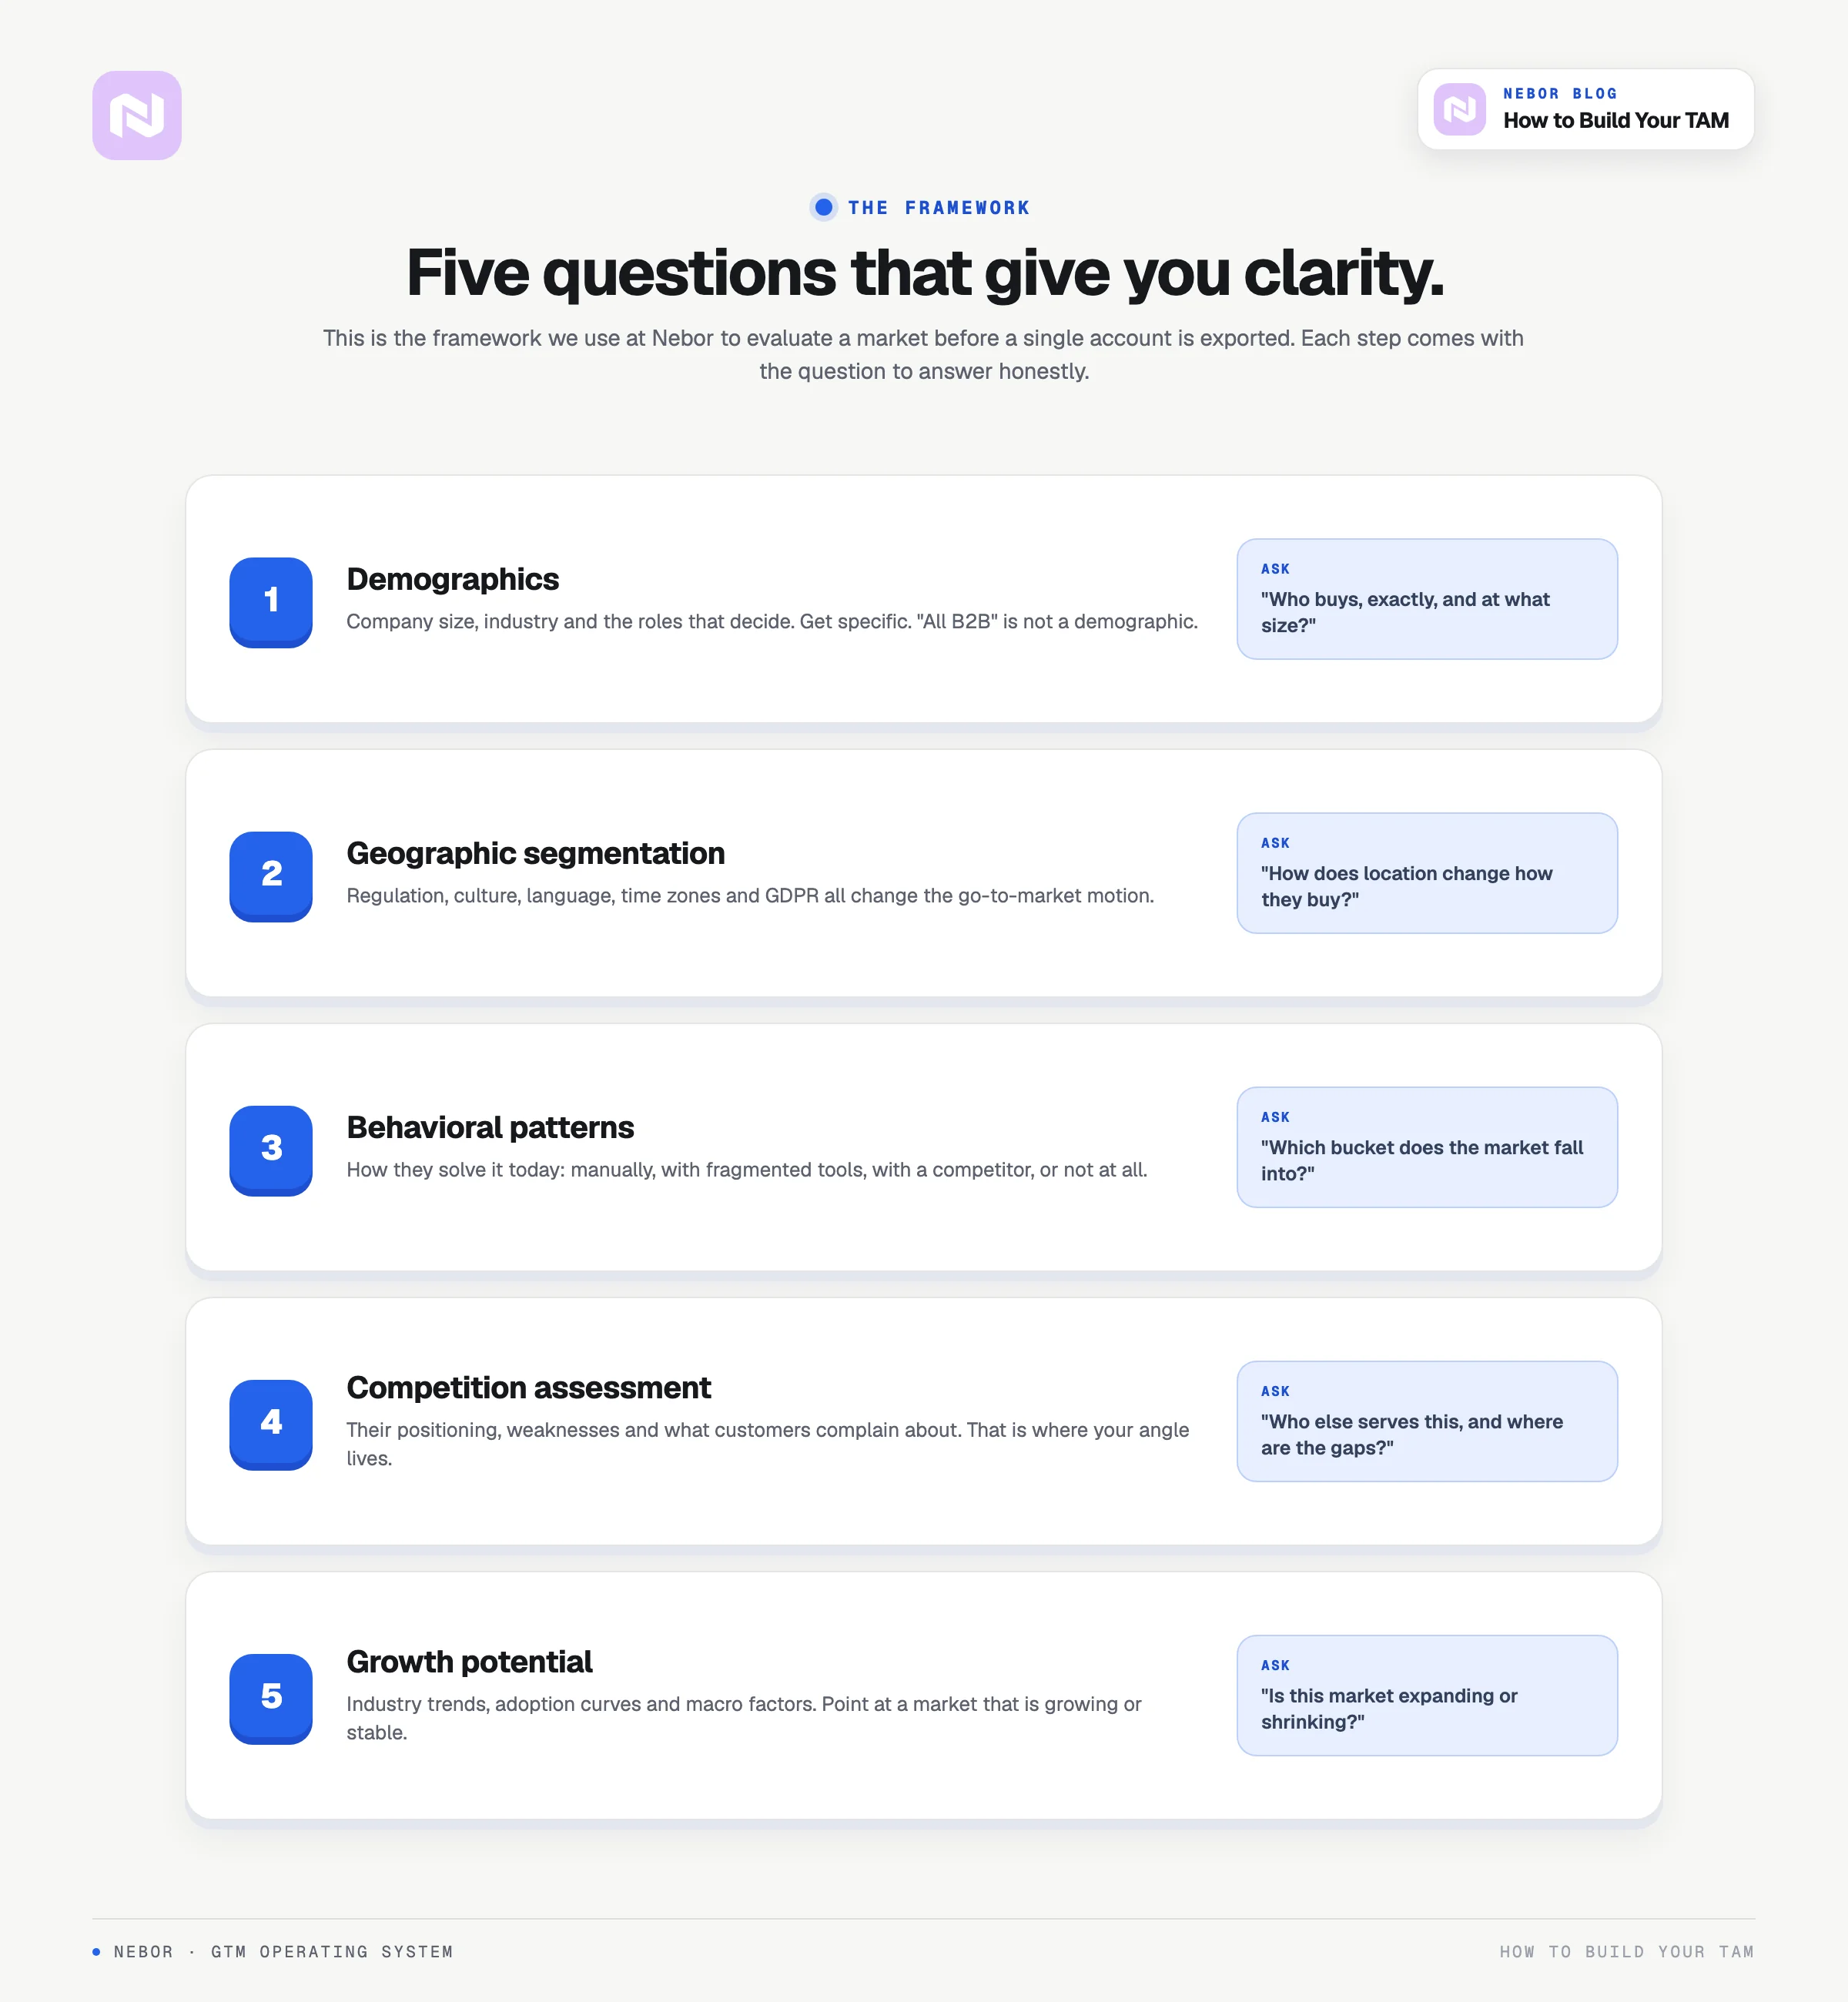
Once you know what you are solving for, here is the framework we use at Nebor to evaluate any market. Be honest with yourself on each one.
Step 1: Demographics analysis: who are your potential customers by company size, industry, and role?
Most companies are way too broad here. "All B2B companies" is not a demographic analysis, and neither is "SaaS companies in North America."
Get specific. What size companies? Which particular market segment? What roles are the decision makers? Are there minimum requirements for them to even be a fit for your target audience?
Step 2: Geographic segmentation: where are these prospects and how does location affect buying behavior?
Regulatory environments, cultural preferences around outbound, language, time zones, and compliance requirements like GDPR all affect your go-to-market motion. A company selling into the Netherlands faces different constraints than one selling into the US. Your TAM needs to account for this.
Step 3: Behavioral patterns: how do they currently solve the problem you address?
Are they using manual processes? Fragmented tools? A competitor? Or not solving it at all? Each requires a completely different approach, and someone who doesn't know they have the problem is the hardest sell of all. Know which bucket your target market falls into before you start reaching out.
Step 4: Competition assessment: who else is serving this market and where are the gaps?
Your competitors chase the same total addressable market. So don't just list them: understand their positioning, their weaknesses, and what customers complain about. That is where your angle lives, and it's what turns a generic market into a defendable one.
Step 5: Growth potential: is this market expanding, contracting, or stable?
If your total addressable market (TAM) is shrinking, no amount of clever outbound saves you. Look at market trends, technology adoption curves, and regulatory shifts, and make sure you are pointed at market growth or at least stability. Selling into a shrinking market burns your investment.
How you map your total addressable market (TAM) depends on where your company is at right now
Most TAM advice hands you a single approach as if every company is in the same position. There's a massive difference between companies with a track record and companies starting from scratch. The framework applies to both, but the inputs are completely different.
Scenario 1: you have a track record, existing clients, CRM data, and deal history
This is the better position. Your TAM mapping starts from the inside out, with real data instead of guesses.
Look at your best existing customers: fastest sales cycles, highest annual contract value (ACV), best retention, most referrals. Those are the ones you want to clone. Reverse engineer the patterns: industry, size, tech stack, and what was happening in their business when they bought. New funding? A new VP of Sales? A scaling pain phase?
Go deeper. Who was the decision maker and who else was involved? How did they hear about you?
Don't forget the losses. Mine your CRM for lost deals and churned customers; sometimes they tell you as much as the wins. If every company under 5 employees churned within 6 months, that is a TAM filter right there. Remove them from your universe.
You are not hypothesizing, you are pattern matching against reality. We've written about how to clean and enrich your CRM data so the patterns you pull are trustworthy.
Scenario 2: you don't have a track record and you are starting from scratch, pre-revenue, or pivoting
Harder but not impossible. Your TAM is a hypothesis until proven otherwise, and you have to treat it that way. The mistake early-stage companies make is building a massive TAM on assumptions and going all in for 6 months before finding out they were wrong.
Instead: get specific about your hypothesis, then test it fast. Pick 3 to 5 segment hypotheses with different pain points and value prop angles, and do small, focused outbound experiments. At 1,000 to 2,000 emails a day, 2 to 4 weeks gives you statistically meaningful signal on which titles engage, which industries care, and which pain points resonate.
You can also reverse engineer competitors: their case studies, the industries on their website, who follows their LinkedIn page. And talk to people. 15 to 20 discovery calls with potential buyers beat a month of desk research, the same mindset behind hiring SDRs and outbound experts that succeed. Ask how they solve the problem today, what they pay, and what frustrates them. Qualitative validation is criminally underused.
The key difference between these two scenarios and why it matters for your budget
With a track record, your TAM is data-driven: you know what works, so map more of it. Without one, it's hypothesis-driven: validate fast before you invest heavily. Either way the sequence holds. ICP first, then TAM, then tiering. You just build the ICP from different sources.
Real example of what an honest TAM looks like (using our own agency)
As a sales automation and go-to-market agency, we could say we target all B2B businesses in the Netherlands, UK, and US. Technically everyone could benefit. But that's not a TAM.
Here's ours when we get honest. Sweet spot: companies between 10 and 100 FTE, primary target up to 50 FTE. Key personas: founders and senior sales, RevOps, and marketers, because those are the decision makers at that size. Geography: US, UK, and NL.
Competition is big, but our proposition is different: we're an agency that helps you become independent from agencies. We build everything in-house for you so you own it permanently, and we bring 10+ years of B2B sales experience, so we know what actually gets replies.
How do our prospects currently handle marketing and sales? Mostly manually, or with fragmented tools, with reps spending 60% of their time on admin. Tech signals that tell us they fit: they use Pipedrive or HubSpot and Slack, they have at least 3 reps, and they're already active in marketing and sales. Recent funding or active hiring makes the timing even better.
See how specific that is compared to "all B2B companies"? That's the difference between a real total addressable market and wishful thinking.
Why exporting 10,000 accounts from Apollo and praying something sticks doesn't work
Most teams treat TAM mapping like a list export problem instead of building AI-driven B2B lead generation systems that continuously refine who is actually in-market.
Open Apollo, Sales Navigator, or Clay. Filter by B2B SaaS, 200 to 500 employees, North America. Boom, 10,000 accounts exported, TAM done. Send the campaigns and hope.
This is exactly why we wrote about why most Clay implementations fail. The export is not the work. The thinking before the export is the work. Here's how we structure it at Nebor.
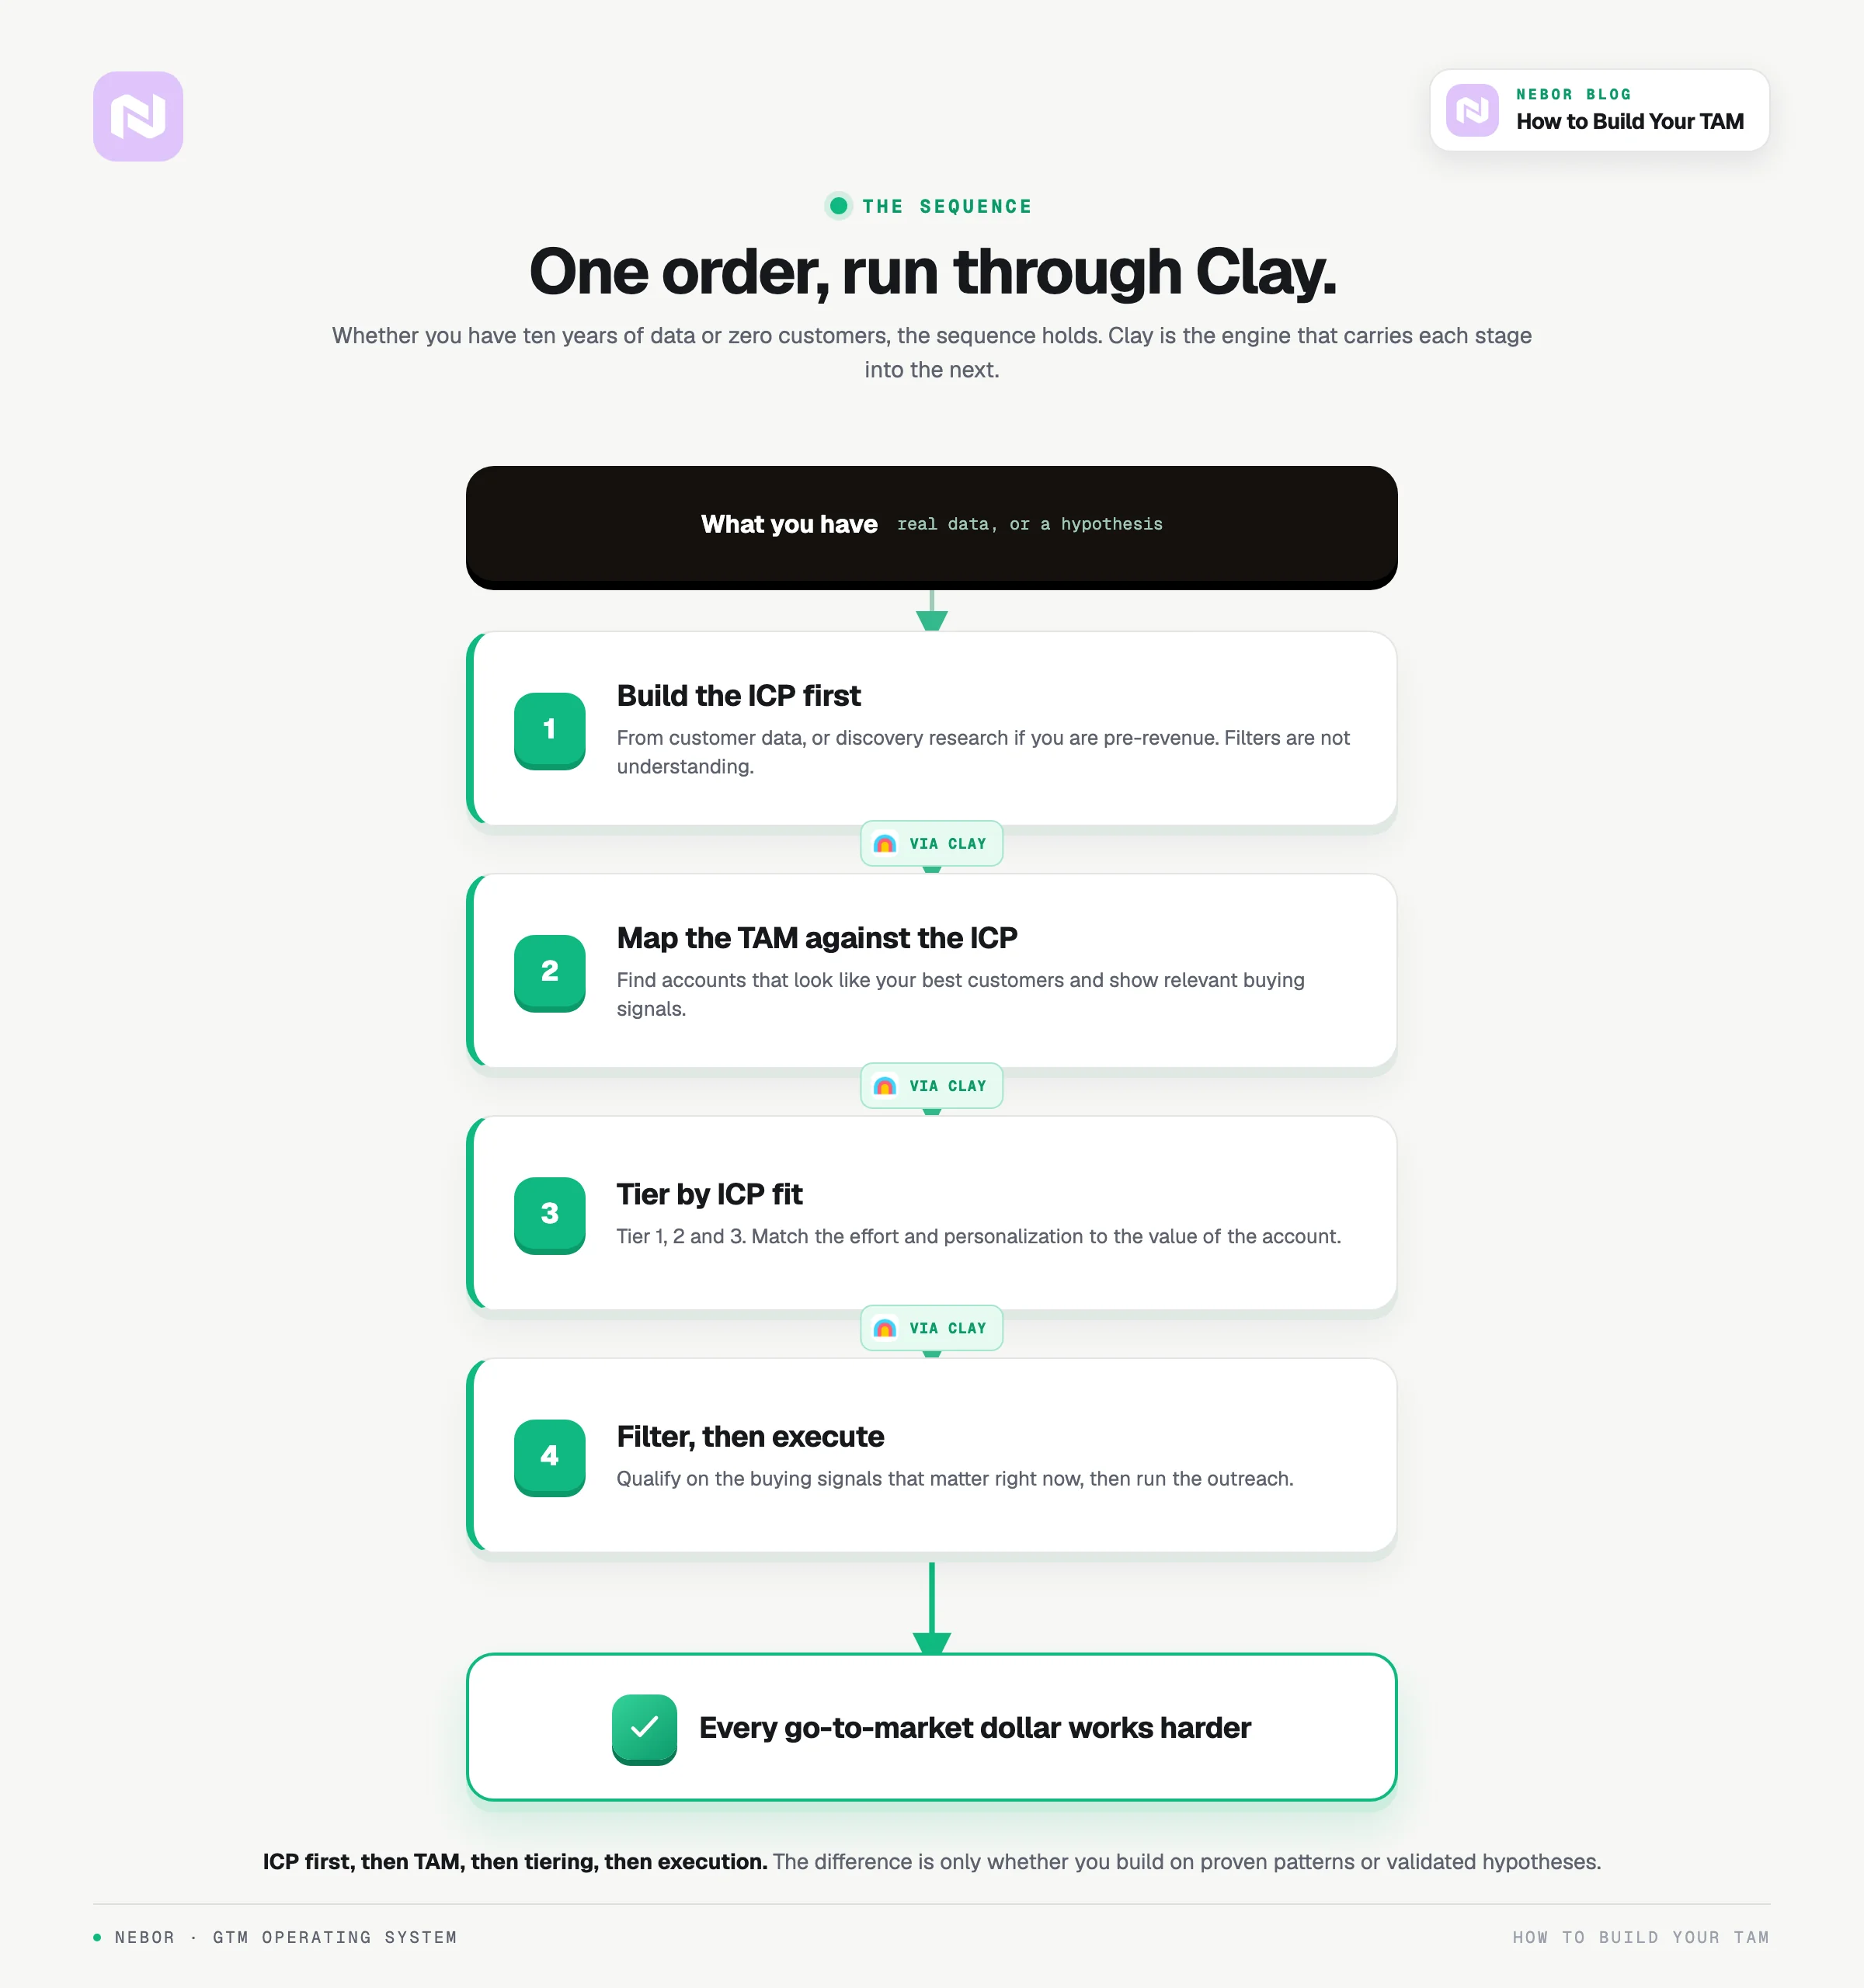
Step 1: always build the ICP before the TAM because filters are not the same as understanding
Get your ICP right first; it's where 90% of TAM exercises go wrong. Look at your existing customer data and the patterns of who actually buys versus who just expresses interest. Do discovery interviews with your best clients: what pain points they had before buying, why they chose you, and what signals showed they were ready.
If you skip this, you're building a prettier version of the same garbage list everyone else works from. No customers yet? Same questions, but the answers come from research and testing instead of historical data.
Step 2: map your TAM against that ICP so every account on your list actually fits
You're not collecting logos. You're finding accounts that look like your best customers and show relevant buying signals. Now TAM mapping has direction: not "who could theoretically buy this?" but "who looks like the people who already bought and loved it?" Without a track record, the question becomes "who matches the profile that responded best in our testing?"
Step 2.5: where to actually find these accounts because no single tool does everything
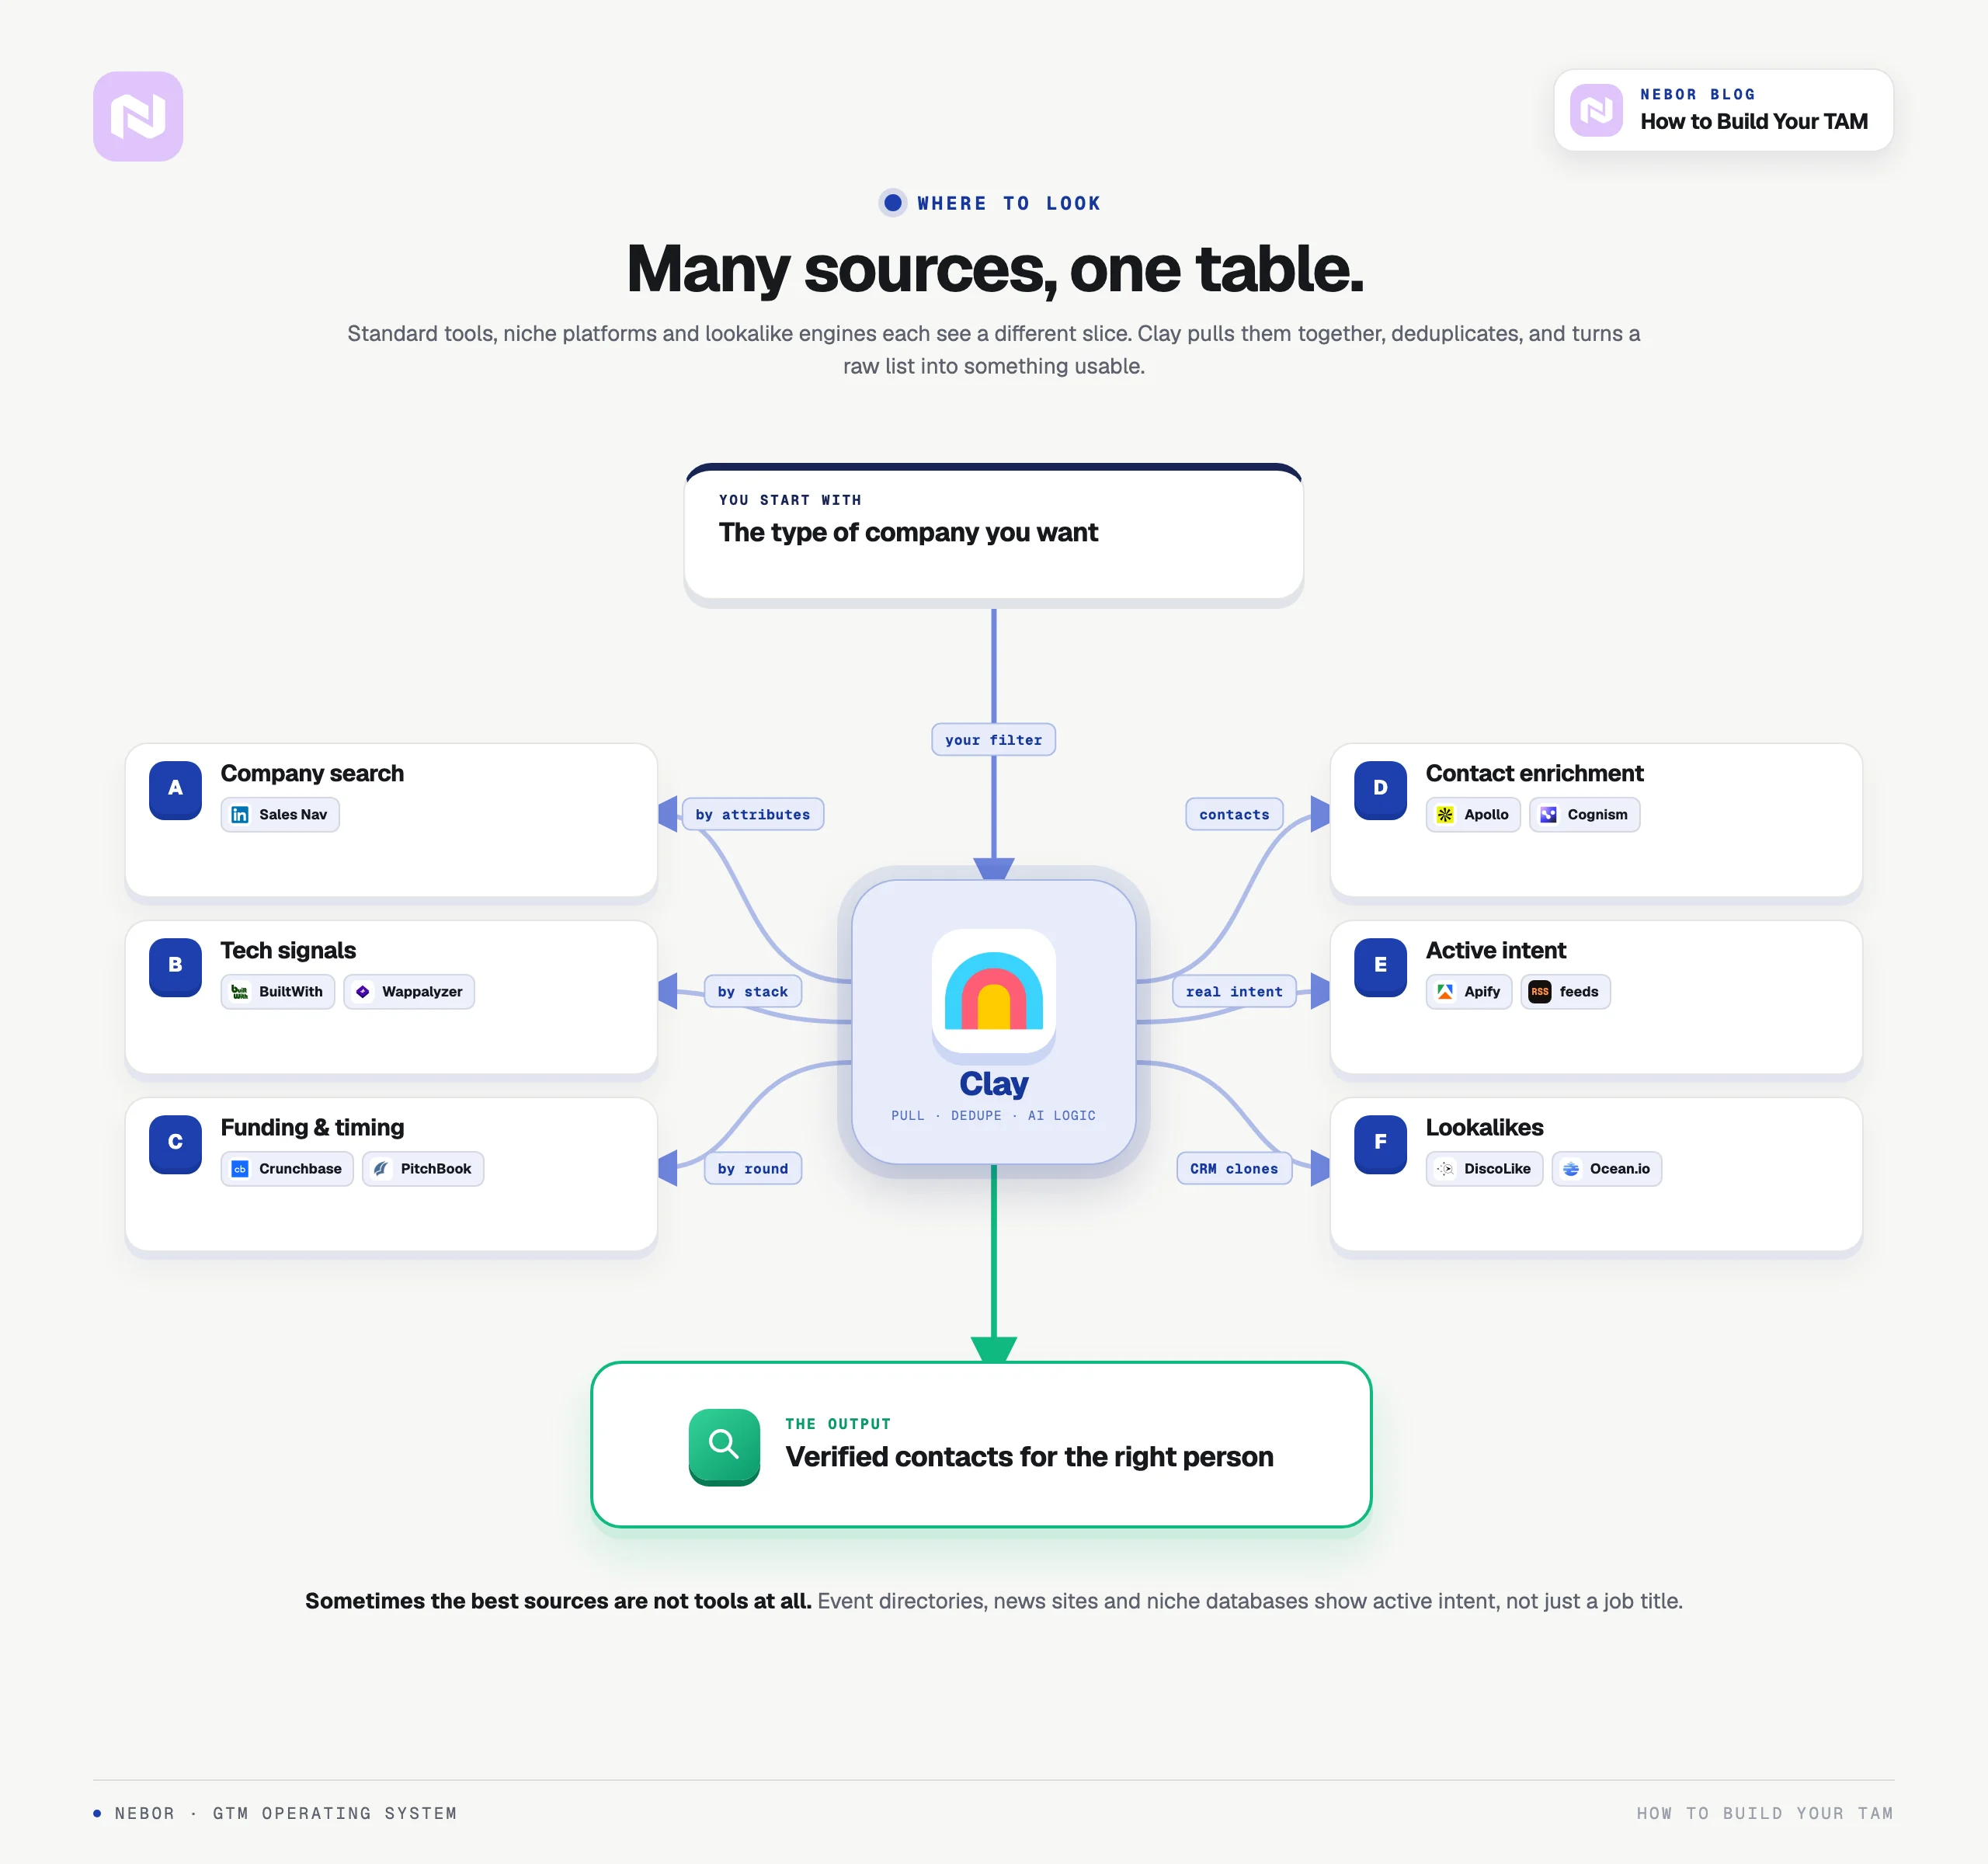
No single tool covers everything, which is why building a sales tech stack that works on autopilot with Clay and n8n matters as much as any one data source.
Sales Navigator handles company search by size, industry, and geography. BuiltWith and Wappalyzer show the tech a company uses. Crunchbase and PitchBook show funding stage and growth trajectory. Apollo, ZoomInfo, and Cognism work best as contact-level enrichment layers after the account list exists.
Clay is at the center: it pulls from multiple sources, deduplicates, applies AI logic, and turns a raw list into something usable.
But sometimes the best data sources are not tools at all. One Nebor client sells AI home and office furnishing solutions; Apollo can't tell you who is furnishing new properties right now, so we set up Apify workflows to monitor publications that report new real estate projects, and that market data flows into Clay automatically.
Another client offers event tech. Instead of searching Event Managers on LinkedIn, we monitor platforms like 10times and Cvent that show who is hosting events right now, often with help from specialized Clay experts. Active intent beats a job title.
Tools like DiscoLike find companies that share characteristics with your best existing customers, TryTelescope searches by natural language, and a GTM systems company that knows Clay can stitch it all into one system. With a track record, export your best 50 customers and search for their patterns at scale. Without one, cast wider and let outbound testing narrow it.
Step 3: tier your effort by ICP fit because not every account deserves the same level of attention
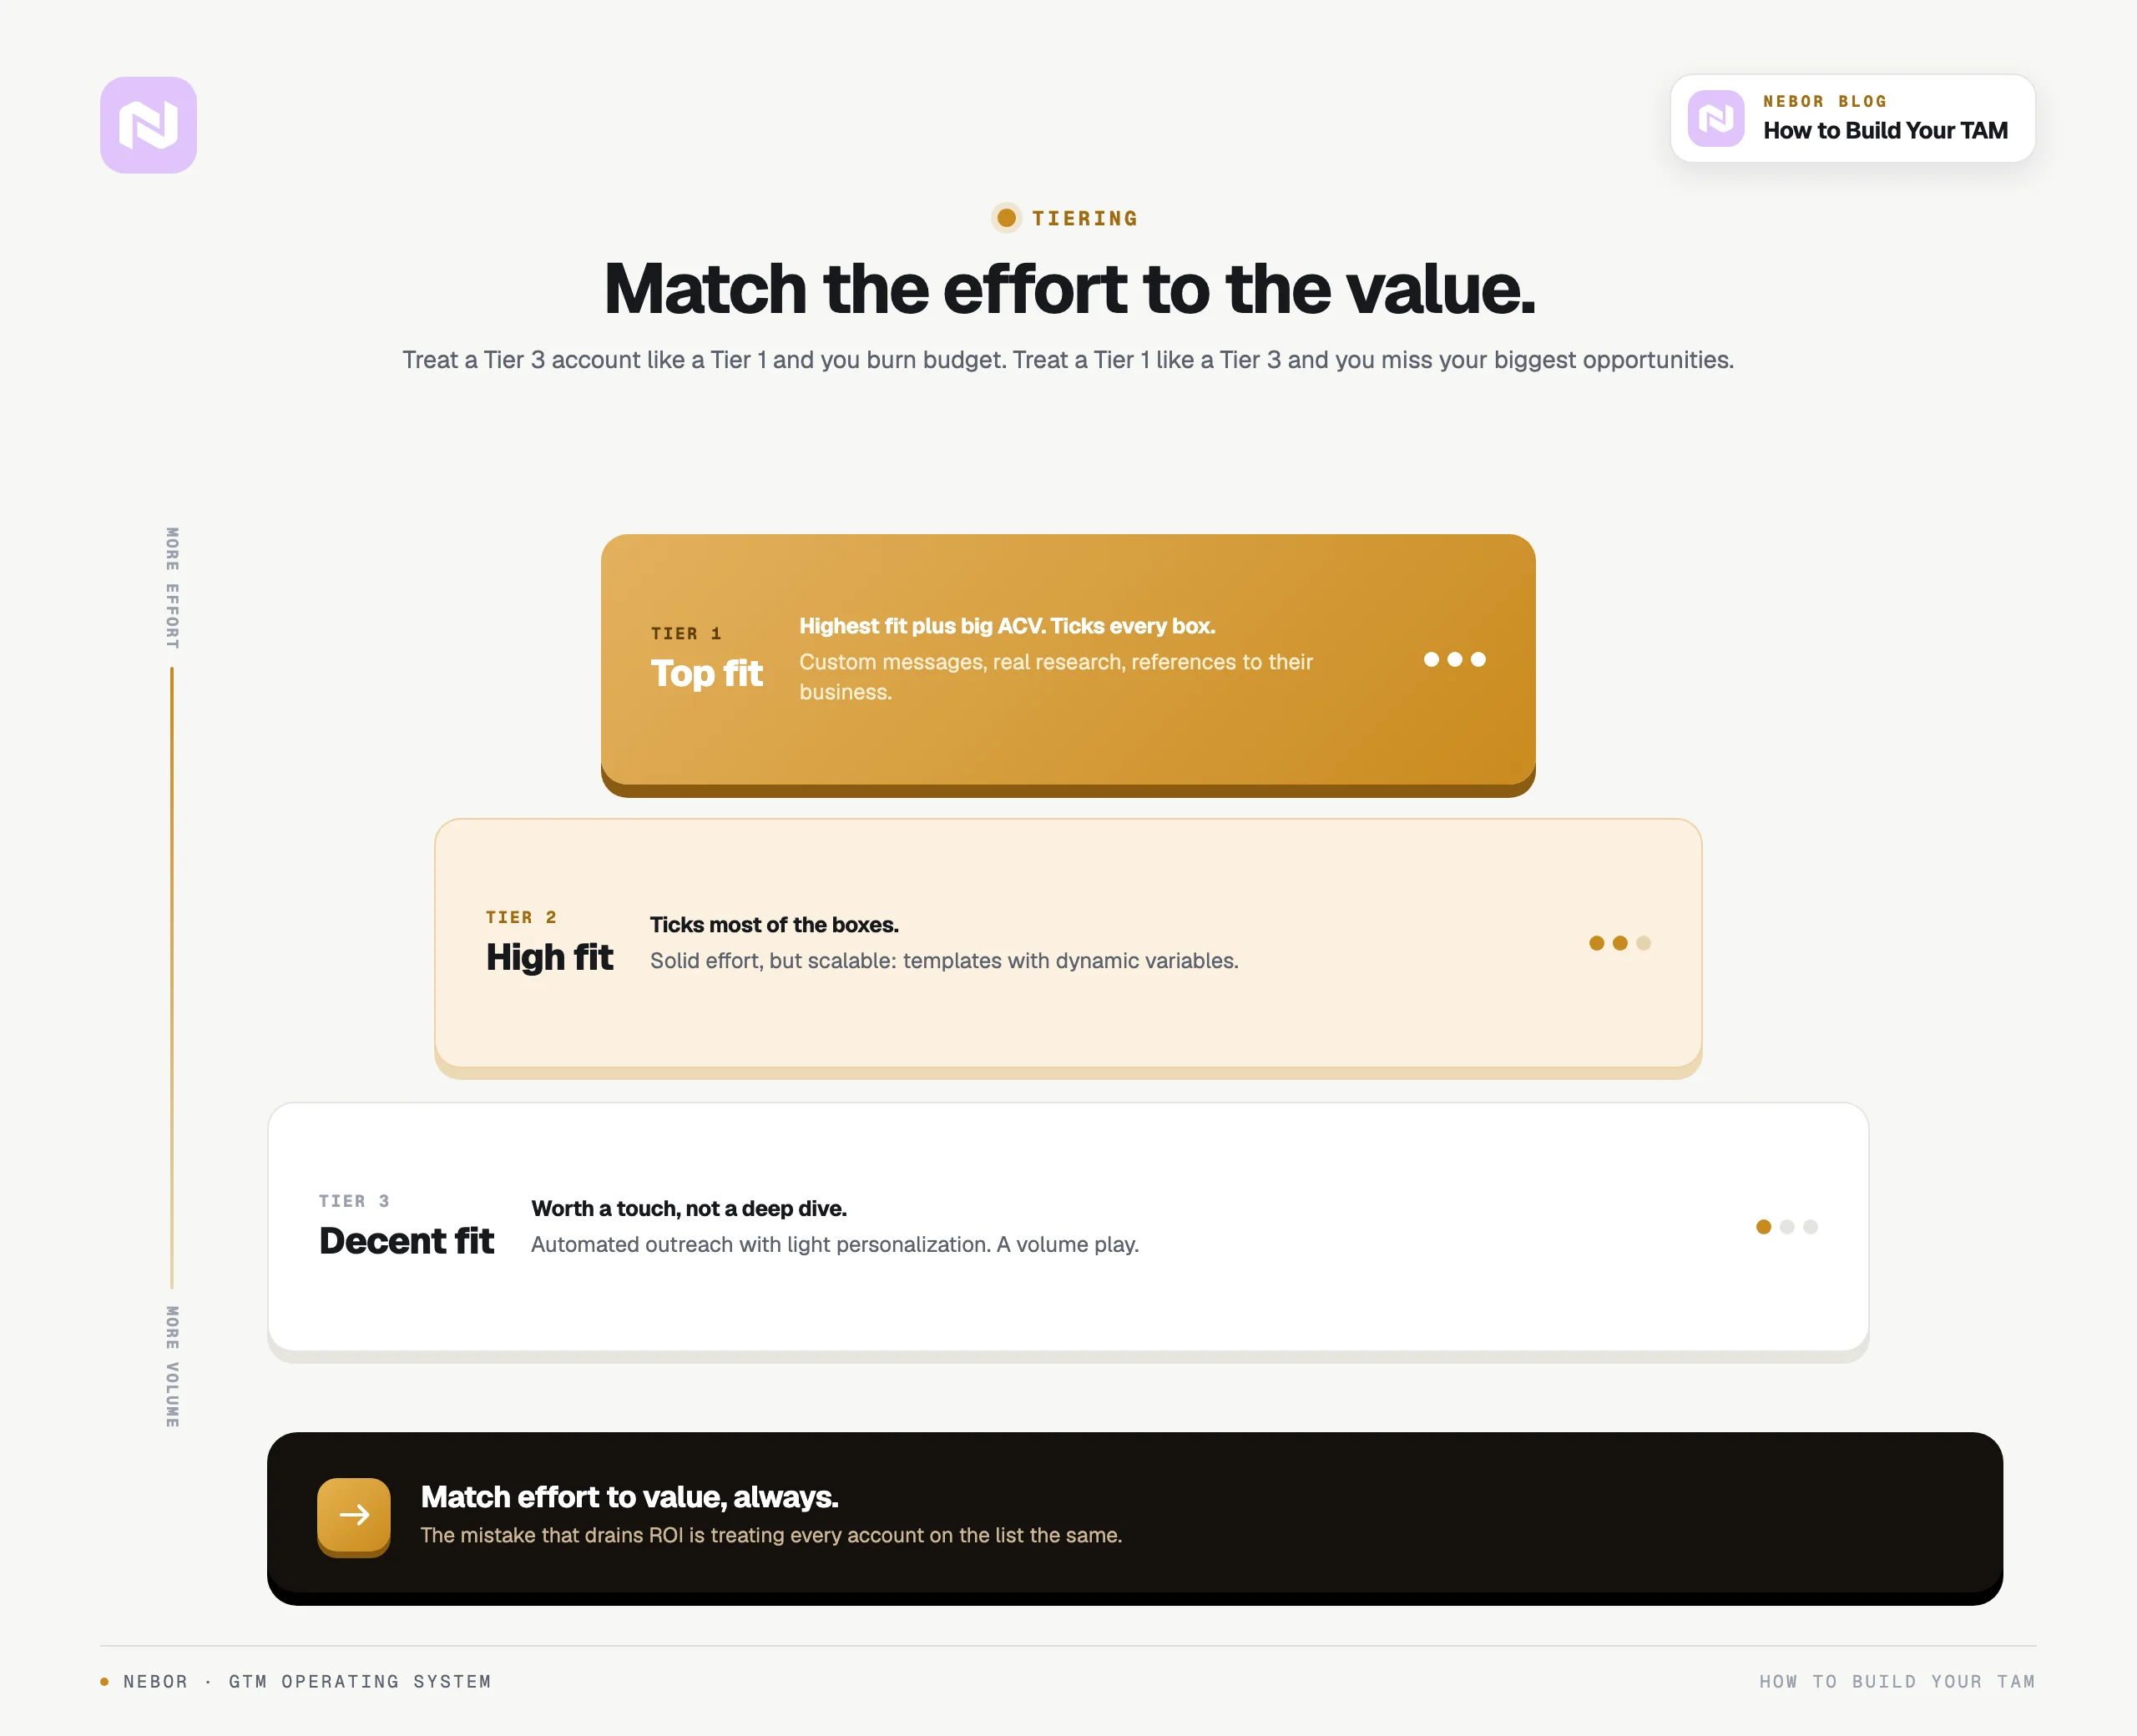
This is where most teams waste the most money: treating every account the same and wondering why ROI is all over the place.
Tier 1 accounts are highest fit plus big ACV, the bulk of the potential revenue on your list. They get the most resources: custom messages, real research, real effort. Tier 2 accounts are high fit and get solid but scalable personalization, templates with dynamic variables. Tier 3 accounts are decent fit and get automated outreach with light personalization. Volume play.
The mistake is treating Tier 3 like Tier 1 (burning budget on accounts that were never worth it) or Tier 1 like Tier 3 (missing your biggest opportunities). Match effort to value, always.
Step 4: once you have your initial list, filter it with the questions that actually matter
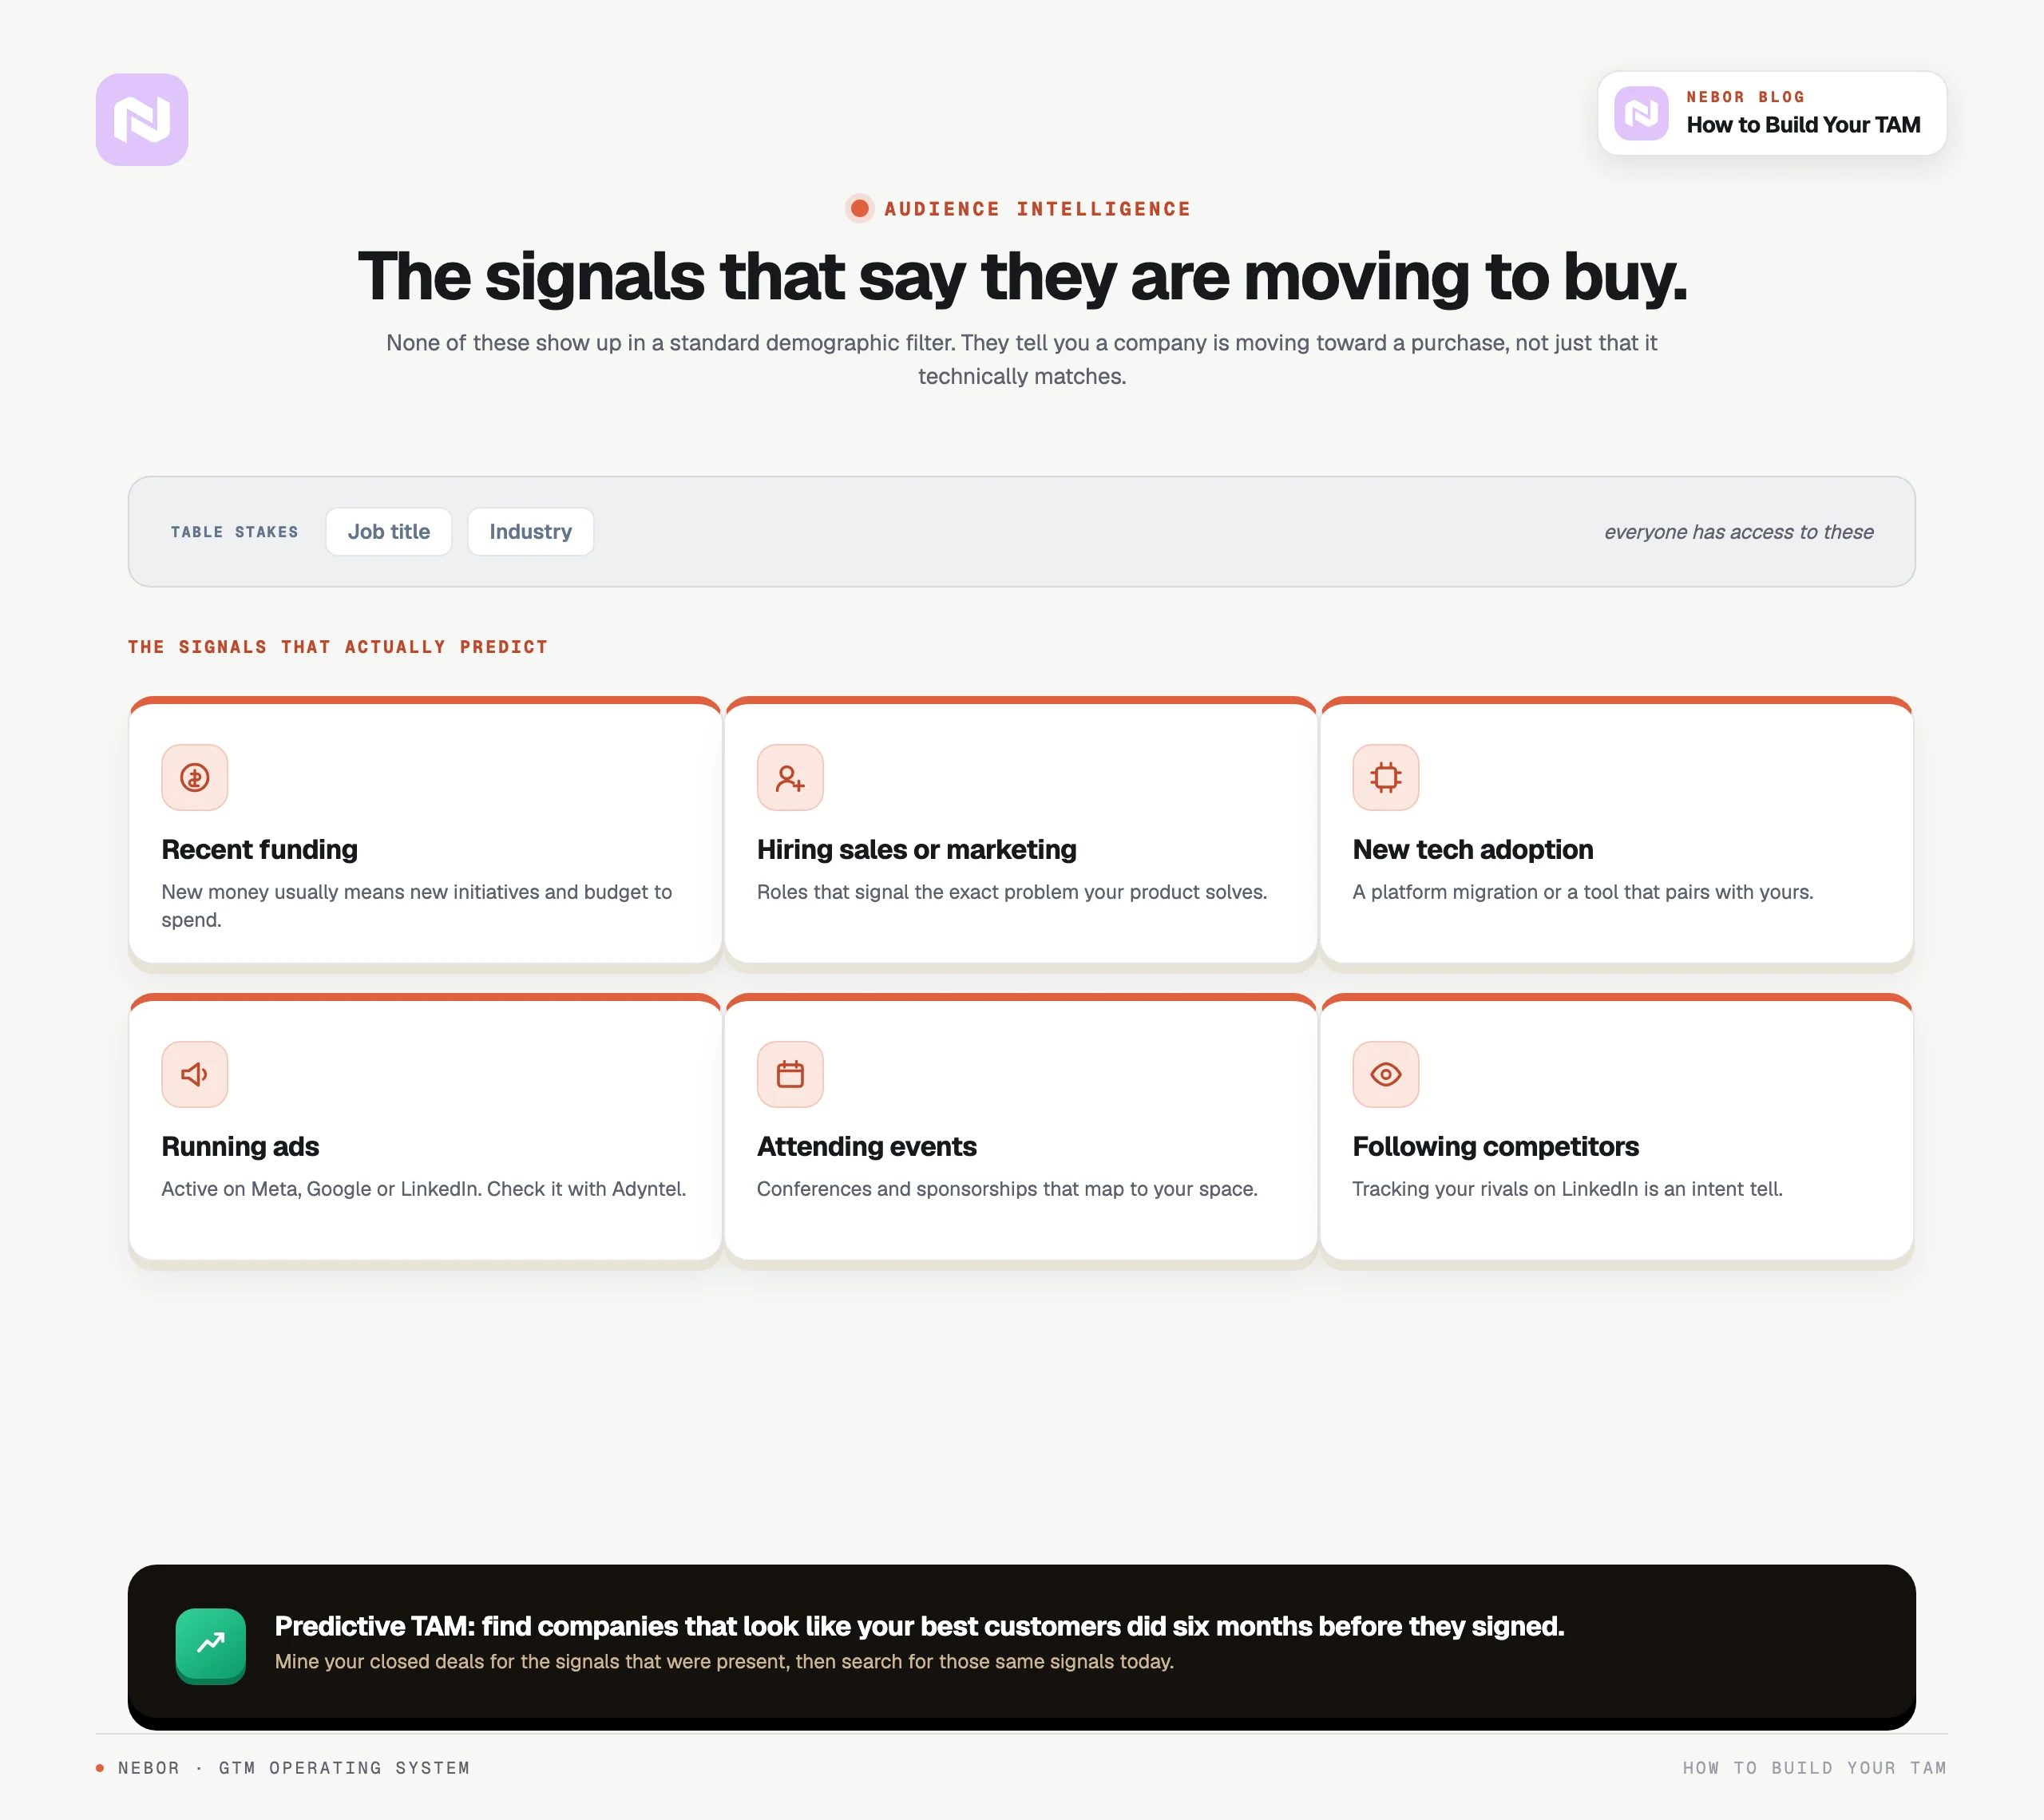
A list is just the start. The real work is qualifying who is worth pursuing now versus later versus never. Some questions to consider:
Are they showing recent buying signals? Have they raised funding?
Are they hiring for roles that signal a problem your product solves?
Have they been featured in industry news for relevant initiatives?
Are they advertising on Meta, Google, and LinkedIn? (Tools like Adyntel can check.)
Does the founder regularly post on LinkedIn?
For companies with a track record, compare these signals against what your best customers looked like 6 months before they signed. That's your predictive model. Without one, these signals become testing variables: send outbound against different combinations and let the results teach you which signals matter.
Why your TAM needs to tie into audience intelligence and go deeper than job title and industry filters
Standard filters are table stakes; everyone has them. What separates companies that nail their target market and their total addressable market (TAM) is understanding what happens before a deal closes: market opportunities show up as signals long before they show up as revenue.
What tech are they using? Recent layoffs or hires? New funding? Which events are they attending? Are they buying ads? All of these are signals that a company is moving toward buying, and none show up in demographic filters.
Companies with a track record can mine closed deals for the signals that preceded them, then hunt for accounts showing those signals today, ideally through a Clay and n8n stack or with top outbound experts. That's predictive TAM mapping. Companies without that data build the signal library over time: document every closed deal's signals, and within a year you have a real predictive model with valuable insights baked in.
TAM vs SAM vs SOM: what serviceable available market and serviceable obtainable market mean
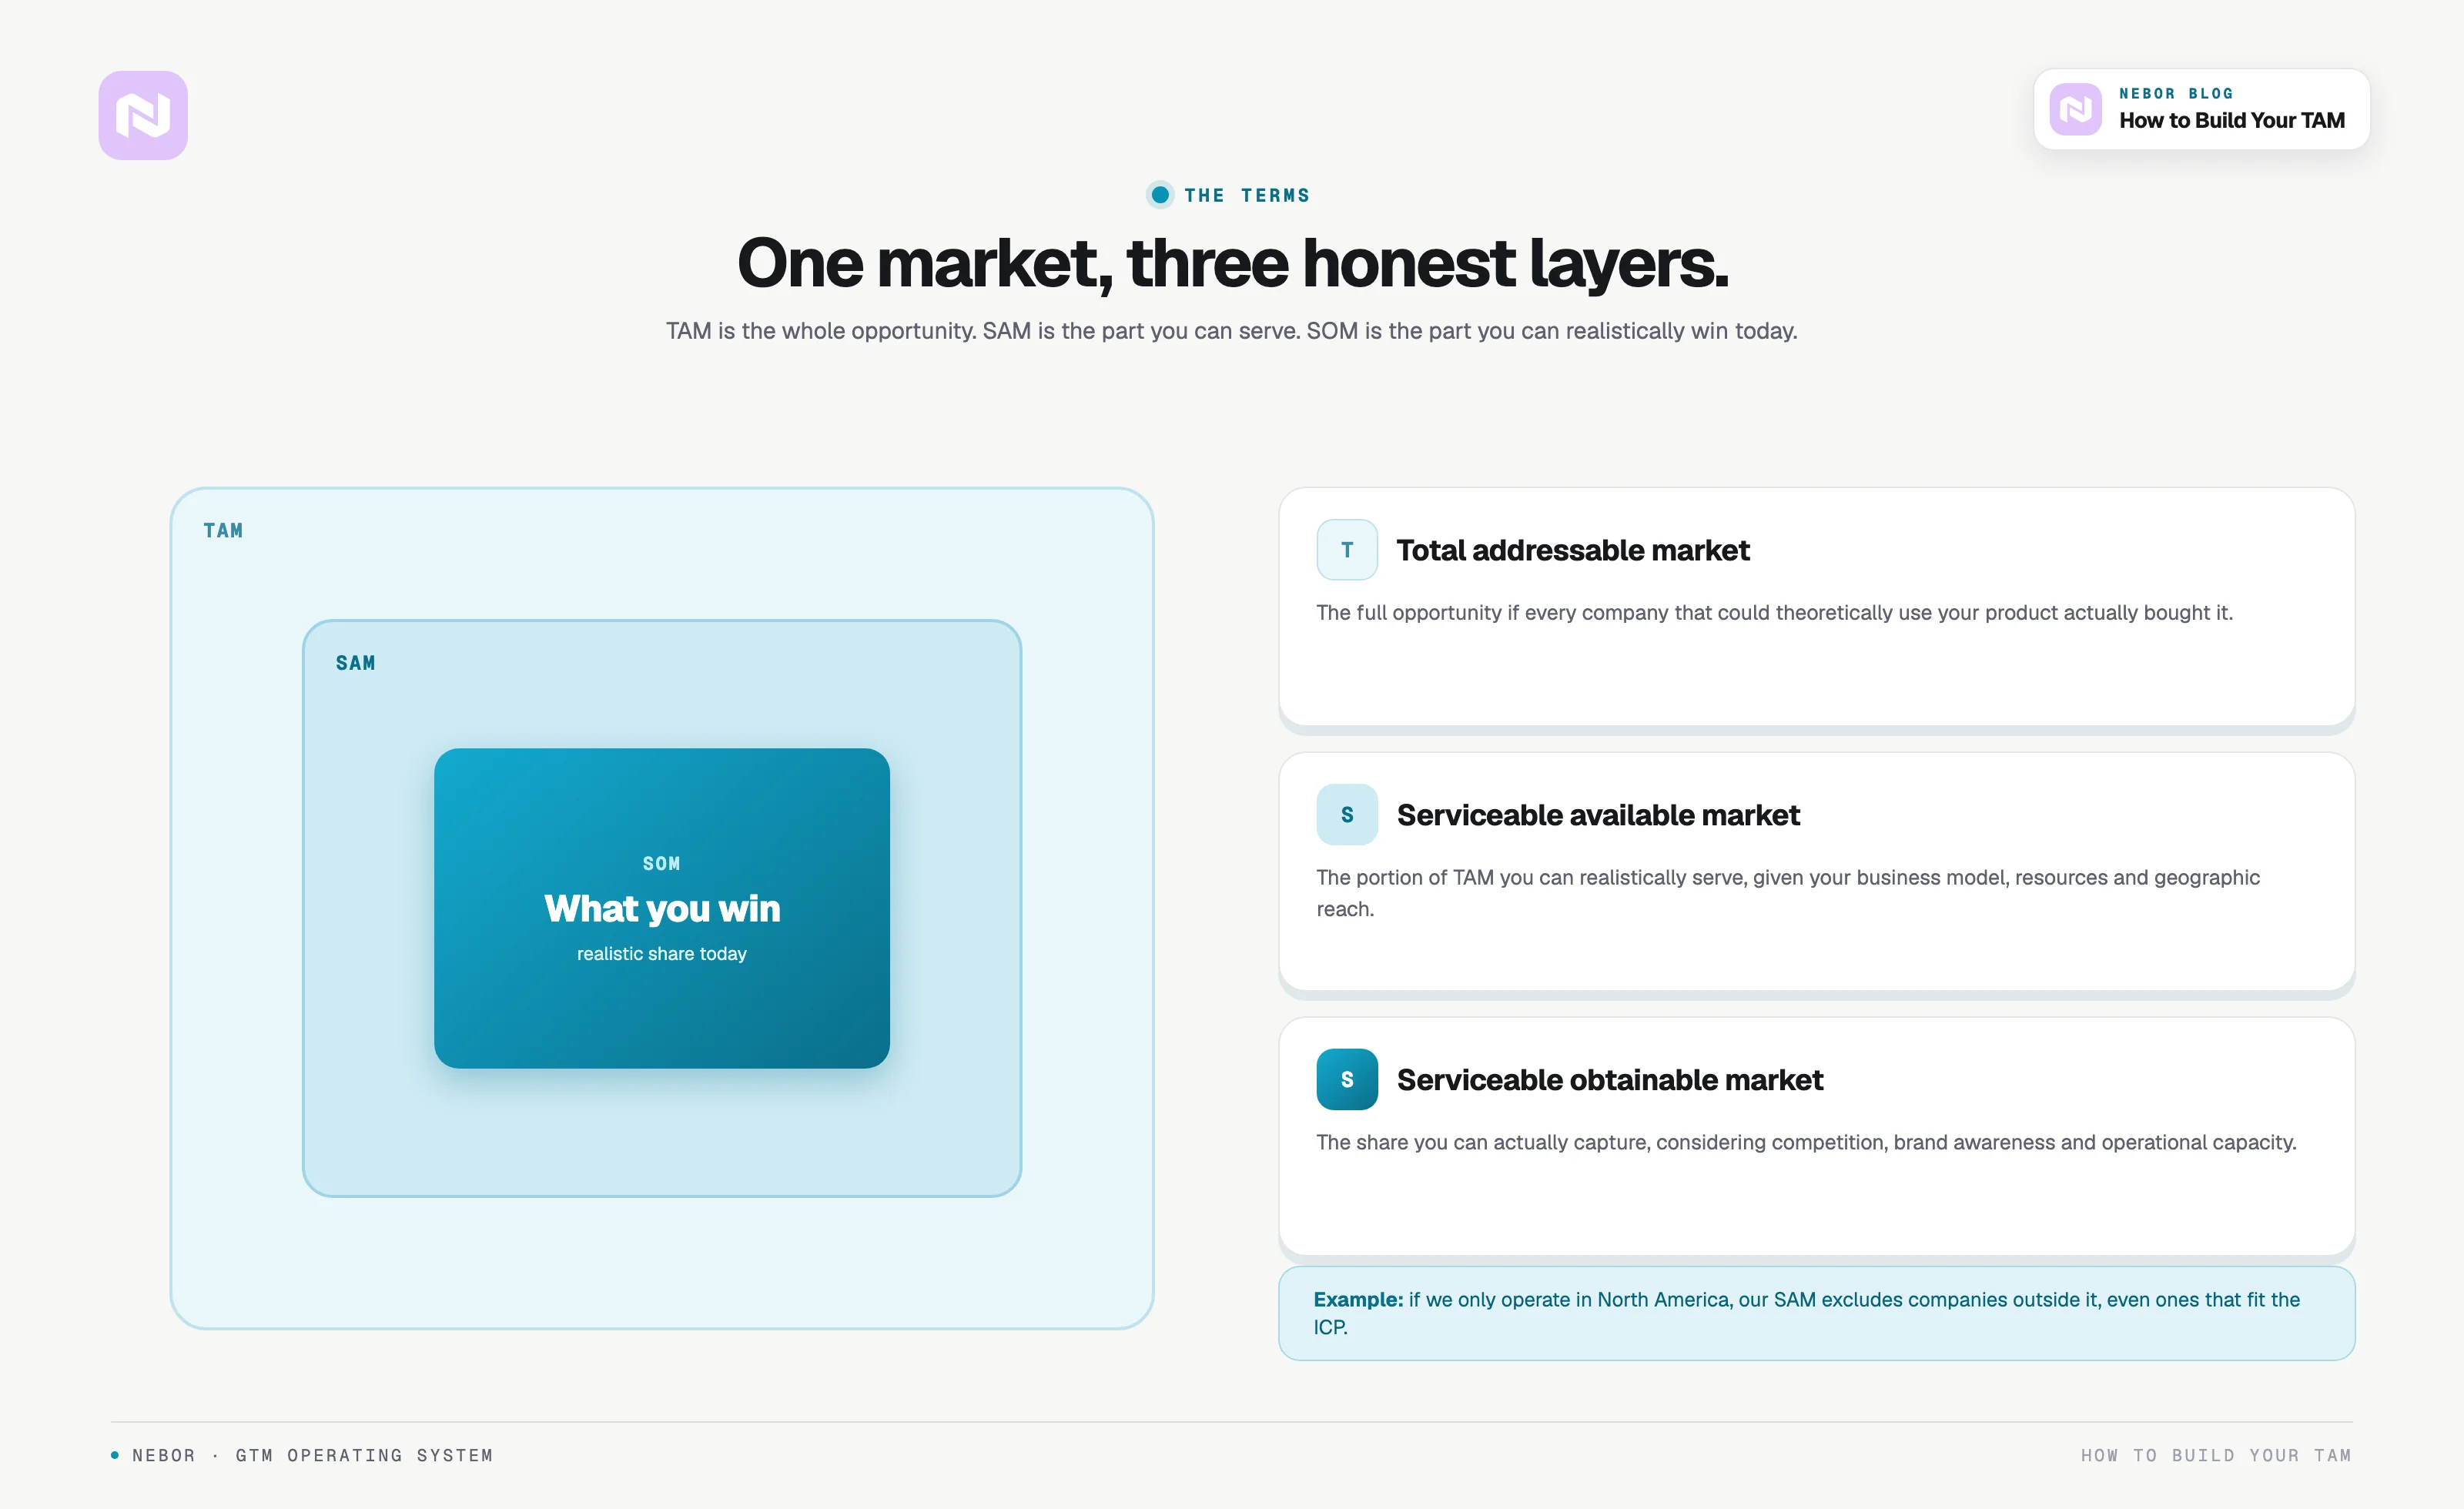
The terminologies (TAM, SAM, SOM) get used interchangeably, so let's break them down properly. Picture three nested circles: TAM is the largest circle, SAM is inside it, and SOM is the smallest at the center.
TAM is your total addressable market: the full revenue opportunity if every company that could theoretically use your product bought it.
SAM is your serviceable available market (also called serviceable addressable market): the portion of the total addressable market (TAM) you can realistically serve given your business model, resources, and geographic reach. Your available market shrinks with every real constraint you admit to, and your potential market narrows to what you can actually serve. If an agency only operates in North America, its SAM excludes companies outside that region, even ones that fit the ideal customer profile.
SOM is your serviceable obtainable market (you'll also see service obtainable market): the portion of the SAM that can be realistically achieved given your competitive landscape, brand awareness, and operational capacity. In other words, SOM is your realistic market share, the target population you can win today.
Understanding the differences between the total addressable market, serviceable addressable market, and serviceable obtainable market matters most for startups, because it drives resource allocation: you fund the SOM you can capture this year rather than the number on the investor slide. Calculating SAM and SOM takes solid market research and an honest evaluation of your strengths, whether you build internally or work with one of the best B2B lead generation companies.
When you focus on these refined metrics, you can develop targeted marketing and sales strategies, allocate resources where they drive the most value, and set realistic revenue goals against real potential customers. You're not chasing the biggest market, but the one you're best positioned to win, and capturing market share there first.
Bottom line: your TAM is not a number you export from a tool
Your total addressable market (TAM) is a living, researched, validated understanding of who your potential customers are and where to find the best of them, and the market share you win follows from how honestly you build it. A TAM calculation is only as good as the ICP behind it. It isn't a static spreadsheet or a one-time exercise, and it's definitely never a number you pull from Apollo and paste into a slide deck.
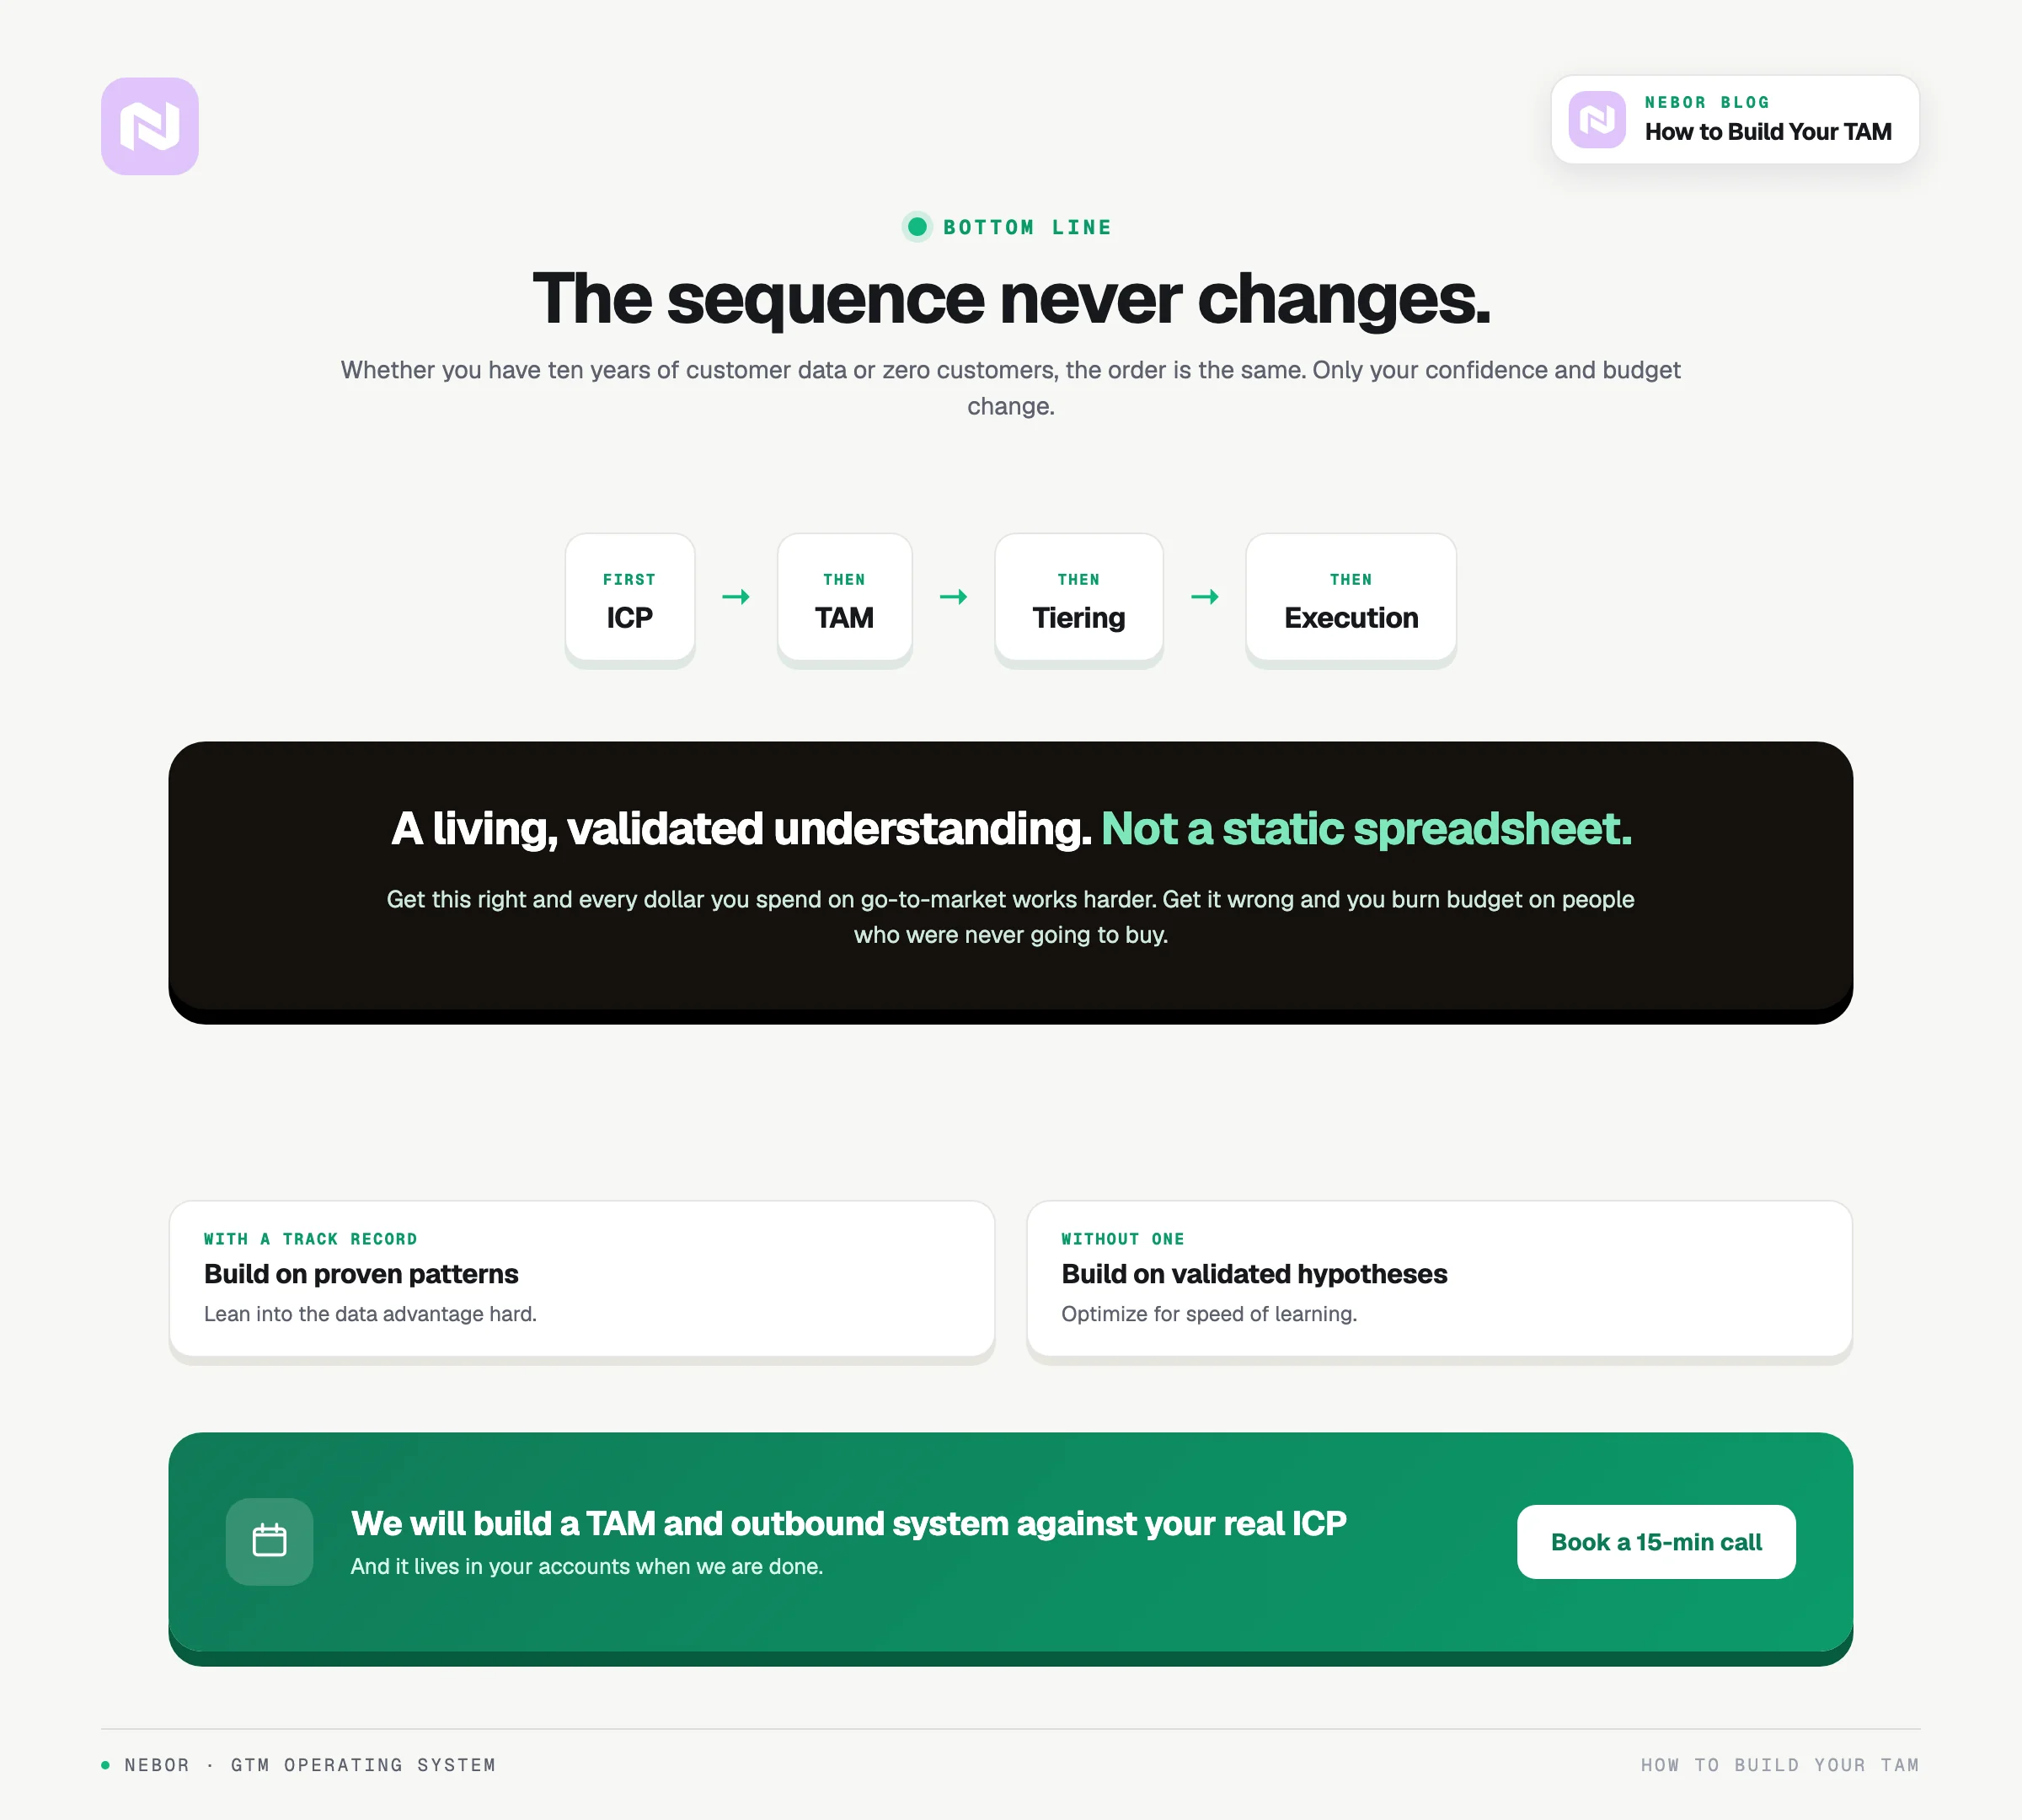
An effective mapping process changes how you identify, evaluate, and capture market opportunities, and it starts from understanding your market potential instead of guessing at it. The framework is always the same: ICP first, then TAM, then tiering, then execution. Whether you have 10 years of customer data or zero customers, the sequence doesn't change. The difference is whether you're building on proven patterns or validated hypotheses. Both work, but knowing which one you're doing changes how much confidence and budget you put behind it.
When your TAM is honest, every dollar you spend on go-to-market works harder, because your sales strategies point at a revenue opportunity that actually exists. Most teams never do this work, and they pay for it in budget burned on people who were never going to buy.
Building this out deliberately is the work most teams skip and pay for later. If you'd rather skip the trial and error and have us build a proper TAM and outbound system against your real ICP, we'd love to talk. We've done this for clients across SaaS, services, and manufacturing, often as a specialized outbound sales agency embedded in their stack.
Book a 15-minute call and we'll walk through what your TAM and outbound system should look like for your specific business.


Related Articles


By clicking Sign Up you're confirming that you agree with our Terms and Conditions.