
In this post:
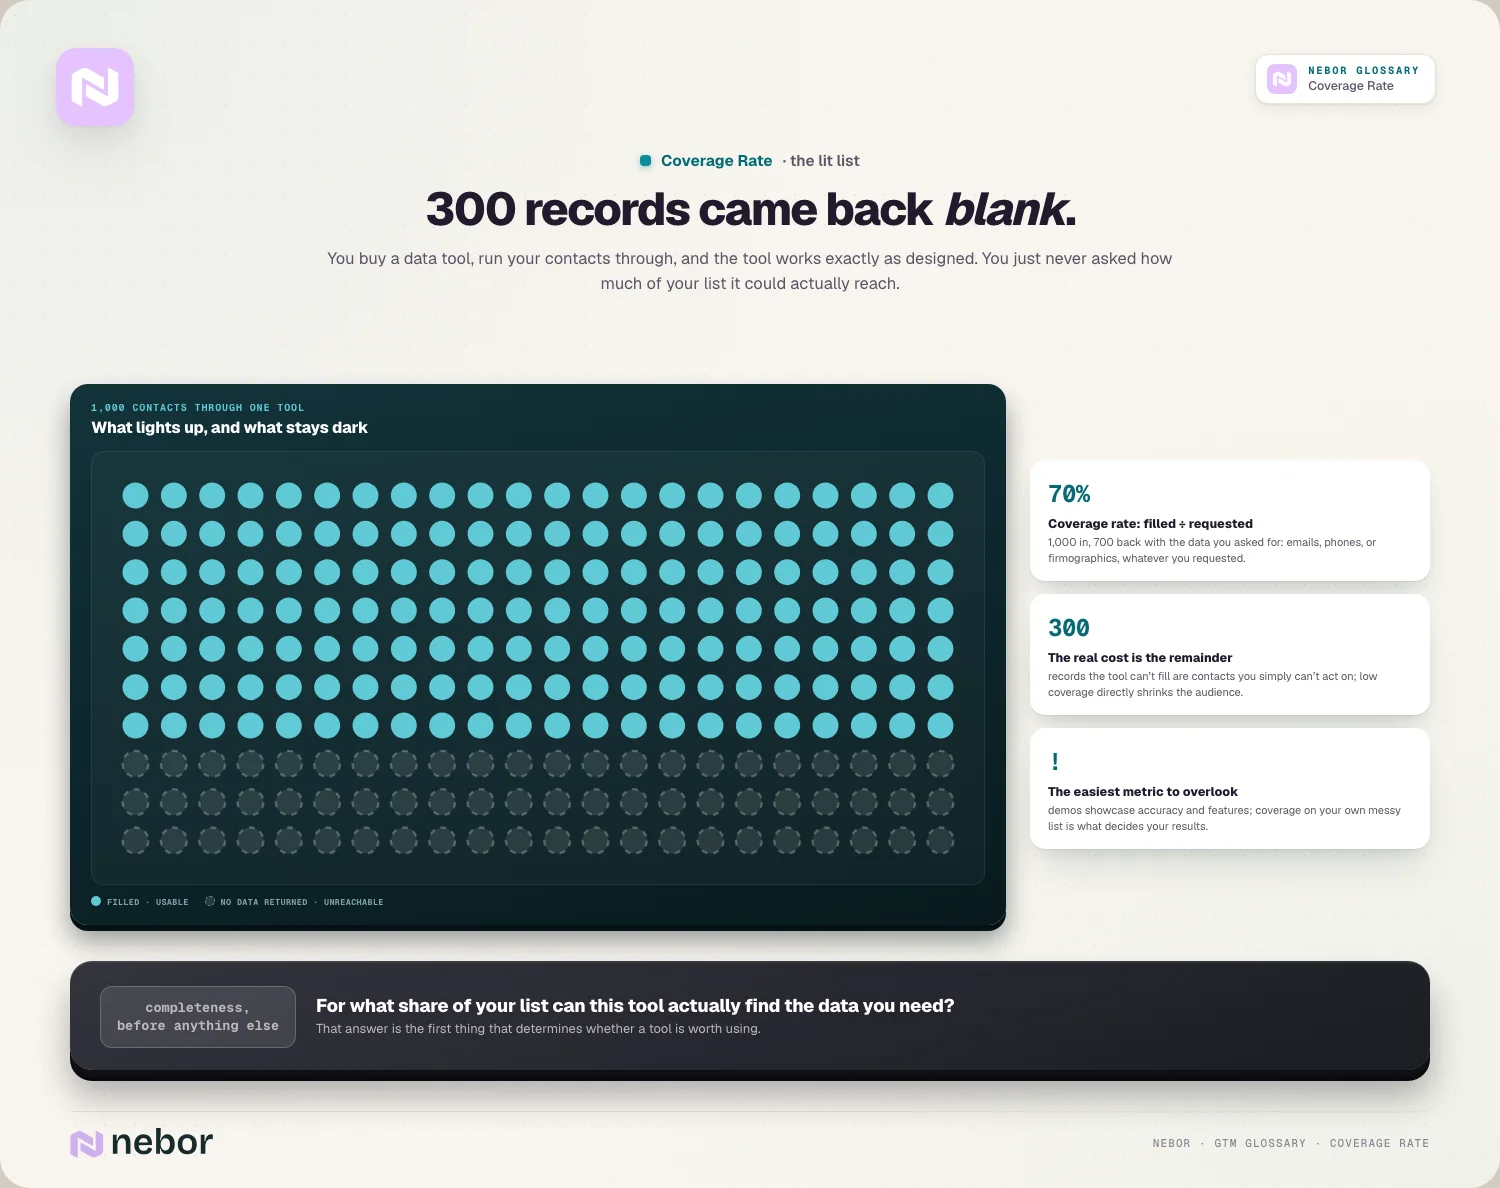
Coverage rate is the percentage of records in your list that a data tool or enrichment process can fill with the data you asked for, such as a verified work email, a direct dial or a company's headcount. Run 1,000 contacts through a tool, get a usable email back for 700 of them, and that tool's email coverage on your list is 70%. The other 300 are people you can't email, however good the tool is on the rest.
Most people first meet the number on a vendor's website, as one figure for a whole database. That figure says very little about you. A tool's coverage of your list depends on who is on it, and the same database that knows nearly every software buyer in Boston can be thin on HR managers at family-owned manufacturers in Limburg. So the question to ask a provider is never "what's your coverage?" It's "what's your coverage of the people I sell to, for the field I need?"
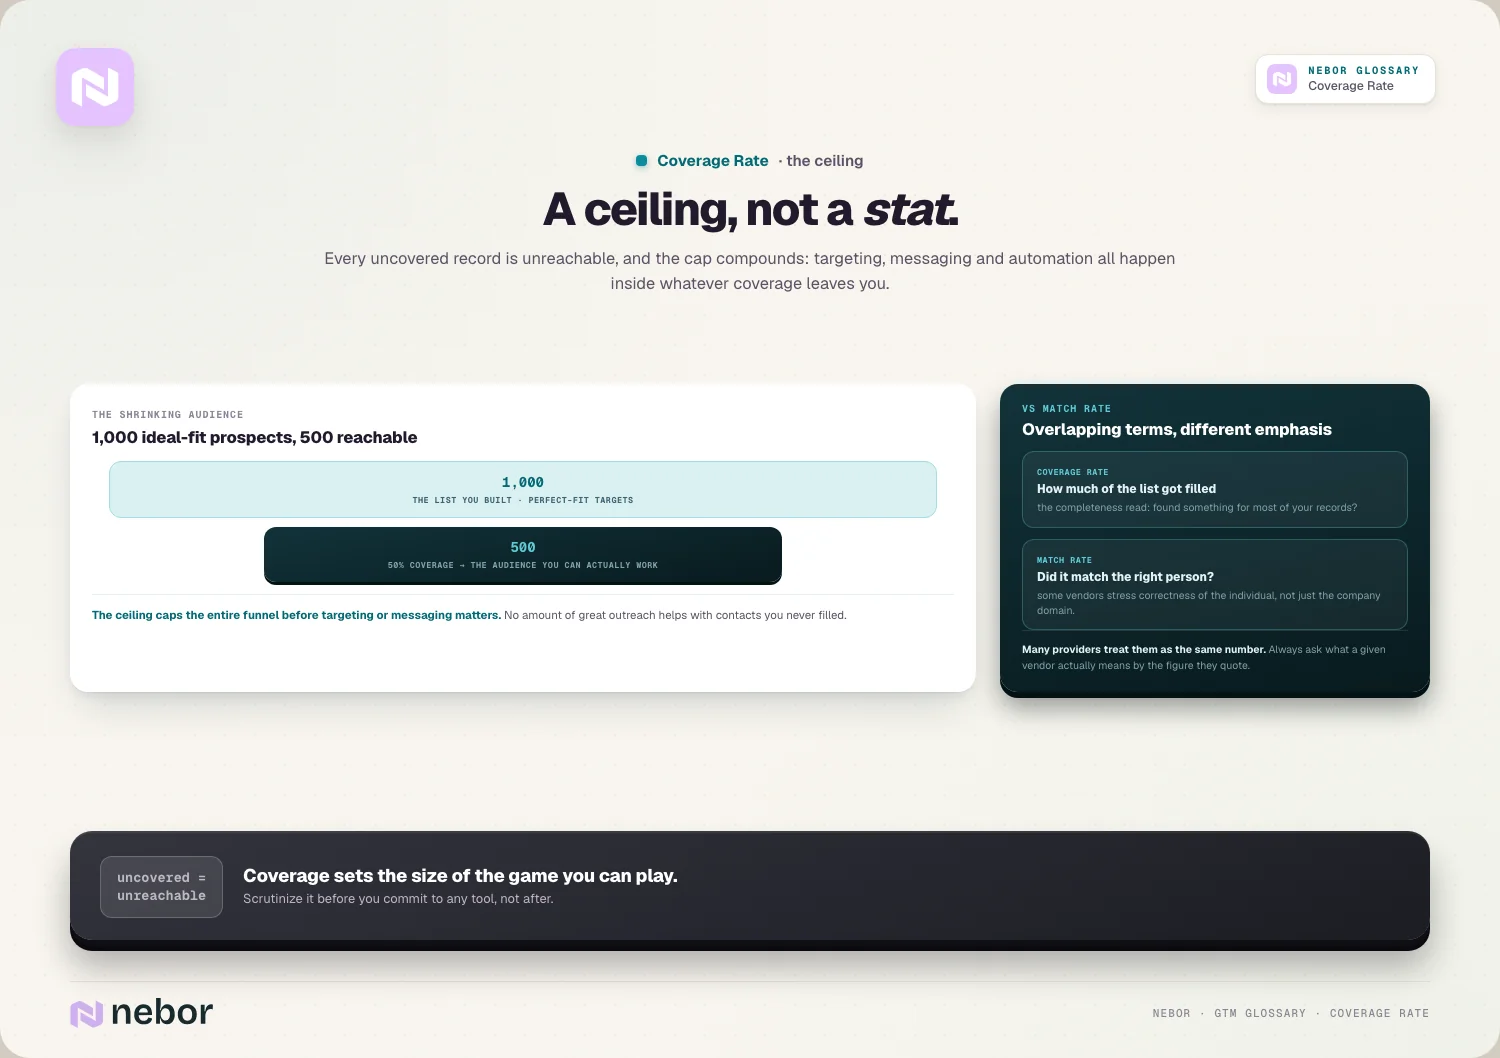
The answer sets a hard limit. At 50% coverage, a list of 1,000 ideal-fit prospects gives you 500 you can reach, and your targeting, your copy and your sequences all work inside those 500.
TL;DR
Coverage rate is the records in your list where a tool returned the field you asked for, in a usable state, divided by the valid records you sent. Count it per field, because email, phone and firmographic coverage can sit far apart.
A matched record can still be missing the phone number you wanted, so coverage for any one field sits at or below the match rate on the same list.
Coverage moves with country, company size, role and field. A single blended figure averages your easy segments with your hard ones, so read it cell by cell.
European, and especially Benelux, coverage often looks different from US coverage for structural reasons: how providers collect contacts, a market made almost entirely of small firms, the GDPR, and job titles written in two or three languages.
Test it on your own list before you sign: run known records through the tool per segment and weight each result by that segment's share of your accounts. A quick count against the KVK or Belgium's company register shows how much of the market behind your list the tool holds at all.
Where coverage stays thin, combine providers that miss different records, use registry and first-party data, and plan channels around what you can actually find. A segment with 9% direct dial coverage needs an email and LinkedIn play, not a calling one.
How to calculate coverage rate on your list
For a list, the formula is simple: records where the source returned the field you need, divided by the valid records you sent, times 100. Valid means the duplicates and empty rows are gone before you start. The match rate entry goes through why that denominator matters and how easily it gets bent in either direction, and the same rules apply here.
Two choices decide whether the result means anything.
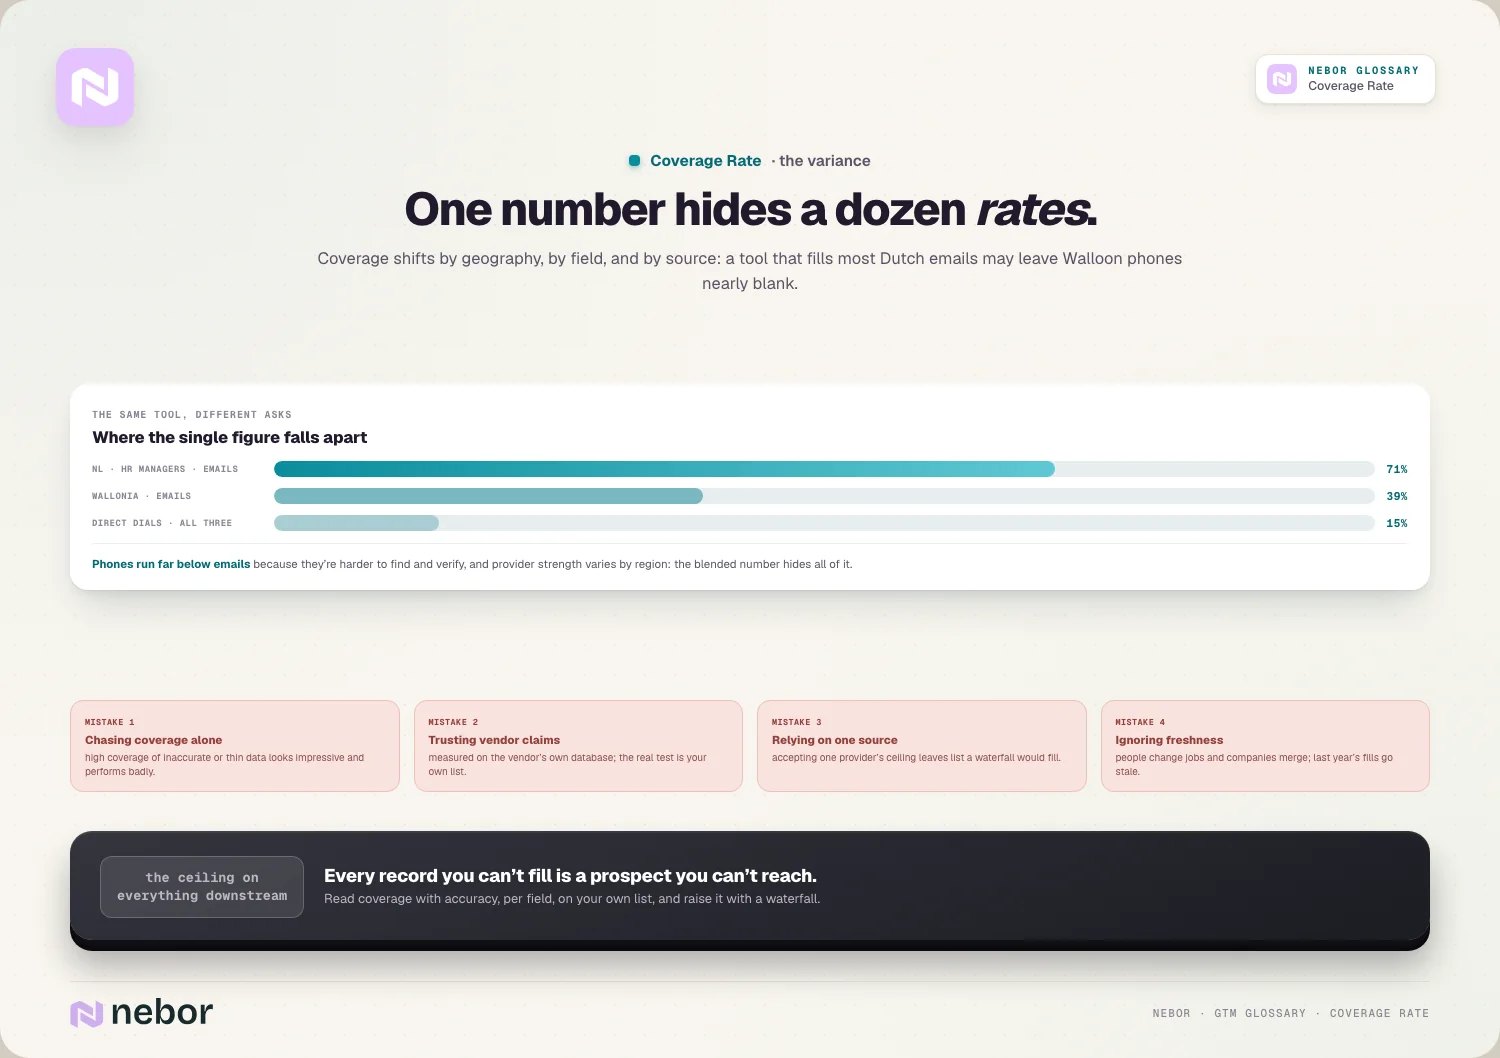
The first is counting per field. Coverage for work emails, mobile numbers, job titles and company revenue are four different numbers, and they can sit very far apart on the same list. A provider that returns 85% of emails and 20% of phone numbers hasn't got "about 50% coverage". It has one figure that suits an email play and another that rules out a calling play.
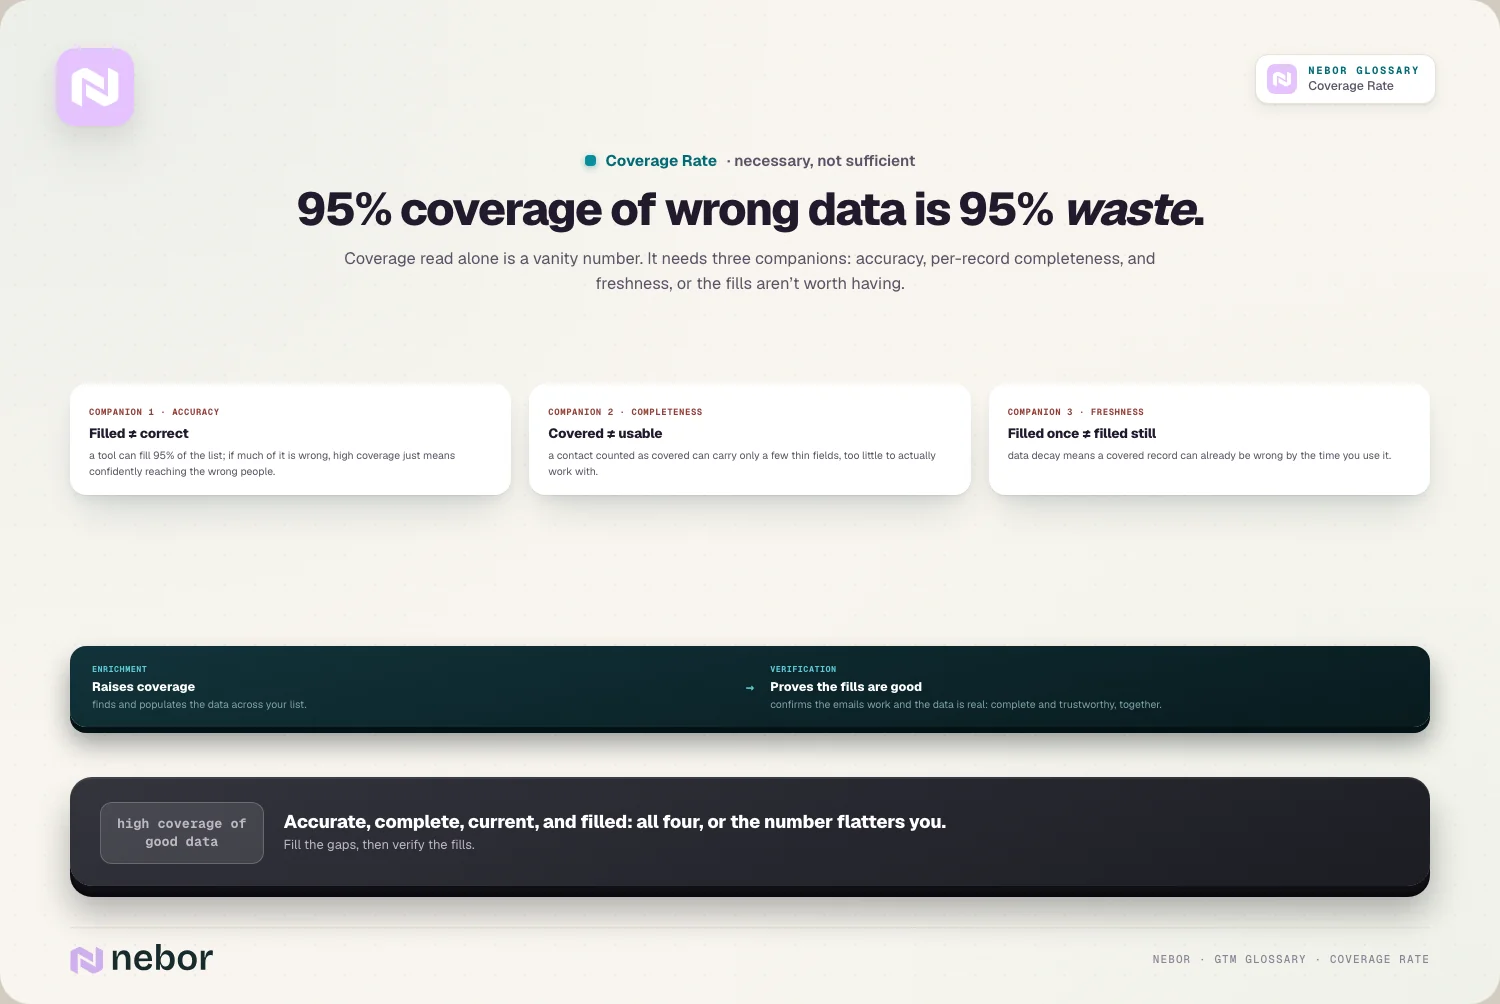
The second is deciding what counts as covered. We only count a record when the returned value is usable, which for an email means it passed contact verification and for a job title means it still matches the person. A tool can fill 95% of a list and still leave you with little, if most of those addresses bounce. Coverage of bad data is just a bigger pile of bad data.
Behind the list sits a related question: how much of the market your list is drawn from does the tool hold at all? A tool can only fill a record it has, so a database that holds few of the companies you sell to will never cover your list well, however clean the list is. Checking this against an independent count of your market, which the test further down does, explains low coverage before you spend money trying to fix it. It's also why the vendor's figure and yours rarely agree. The vendor divides by the records in its own database. You divide by the list you actually want to work.
Where coverage rate drops: country, company size, role and field
Every database is deeper in some places than others, and four splits explain most of the pattern.
Country
Providers build their records from the sources they can reach, and those sources are unevenly spread. The data provider entry walks through the main collection methods. The short version is that a database fed by users who share their address books, and by crawling English-language company pages, ends up deepest wherever most of those users and pages are. A provider can be excellent in one country and patchy in the next one over.
Company size
Large companies leave a public trail: press releases, annual reports, conference speakers, staff pages, job posts. A 60-person machine builder in Brabant may have a website with a contact form and nothing else. Coverage of companies this size tends to fall away first, especially for named people below the owner or managing director.
Role and seniority
Founders, CEOs and sales leaders are visible because being visible is part of their job. Operations managers, planners and HR advisers often aren't on LinkedIn in a way a crawler can read, and they rarely appear on company websites. If your buyer sits in the middle of the org chart, expect lower coverage than the vendor's headline, which is usually driven by the senior titles everyone searches for.
Field
Company facts are easier to collect than personal ones. Name, industry, address and rough headcount are close to public. Work emails can often be inferred from a domain's address pattern and then verified. Direct dials and mobile numbers are the hardest, because they rarely appear anywhere public, so providers rely on contributors or on calling to check them. That's why phone coverage usually sits far below email coverage on the same list.
Why Benelux coverage often differs from US coverage
Teams selling into the Netherlands and Belgium often like a provider's results on a few US test names, then watch coverage drop on their real list. Several things about the market push in the same direction.
The economy is made of small companies. The European Commission notes that SMEs represent 99% of all businesses in the EU, and small firms are exactly the ones with the thinnest public footprint. A Benelux ICP of companies with 50 to 249 employees is full of businesses that a crawler sees as little more than a homepage and an address.
Personal data rules apply to business contacts too. Under the GDPR, a work email with a person's name in it is personal data. The regulation's recitals accept that processing personal data for direct marketing may be regarded as a legitimate interest, but only after weighing it against the person's own interests, and people keep the right to object and to be told where their data came from. That's real work for anyone holding EU contact records at scale, and one more reason not to assume a provider's US depth carries over.
Titles come in several languages. The same job can be "HR manager", "P&O-adviseur" or "hoofd personeelszaken" in the Netherlands, and "HR-verantwoordelijke" or "responsable RH" in Belgium. A managing director might be a "directeur", a "bedrijfsleider", a "zaakvoerder" or a "gérant". A search built on English titles misses many of them, so a provider can hold the person and you'll still record a gap. Some of what looks like low coverage is really a filter problem, which is worth fixing before you blame the data.
Public registers help with companies, not people. The Dutch Business Register shows business activities and the number of people working at each establishment as public information, though not officials' phone numbers. That makes company-level coverage easier to check in the Benelux than contact-level coverage, which is useful when you test.
Testing coverage rate on your own list before you sign
A vendor's figure was measured on someone else's list. Yours comes from running your own records through the tool, with a quick check on the market behind them.
Take a company in Den Bosch that sells HR software to manufacturers with 50 to 249 employees in the Netherlands and Belgium. Its target account list holds 3,000 companies: 1,800 in the Netherlands, 750 in Flanders and 450 in Wallonia.
The market check comes first because it explains the rest. It starts from an independent count. The Dutch figure comes from the KVK register, filtered on manufacturing activities and the number of people employed. For Belgium, the CBE's open data files list every active registered entity for free, which gives a starting list to narrow down. Then the team runs the same filters in each provider's search. One candidate returns 1,620 of the 1,800 Dutch companies (90%) but holds an HR contact at only 1,350 of them, which is 75% of the Dutch companies the team wants to reach. However clean the team's list is, that source can't fill HR contacts for more than about three in four Dutch accounts, because it doesn't hold the rest.
The coverage rate itself comes from the record check, using people the team already knows: customers, recent deals and contacts reps spoke to this quarter. It takes 100 per segment, strips them back to name and company domain, and sends the same 300 records to every provider. Here's what the strongest candidate returned.
Segment | Records sent | Verified email found | Email coverage | Direct dial found | Dial coverage |
|---|---|---|---|---|---|
Netherlands, HR manager | 100 | 71 | 71% | 22 | 22% |
Flanders, HR manager | 100 | 58 | 58% | 15 | 15% |
Wallonia, responsable RH | 100 | 39 | 39% | 9 | 9% |
All three | 300 | 168 | 56% | 46 | 15% |
The bottom row is the number most teams would report, and it's wrong for planning in two ways. It hides the fact that Wallonia, at 39% email coverage, needs a different plan. And it treats three equal samples as if they were three equal markets.
Weight each segment by its share of the account list instead. The Netherlands is 60% of the 3,000 accounts, Flanders 25% and Wallonia 15%, so email coverage across the full account list is (0.60 × 71%) + (0.25 × 58%) + (0.15 × 39%) = 42.6 + 14.5 + 5.85, or about 63%. Dial coverage works out at (0.60 × 22%) + (0.25 × 15%) + (0.15 × 9%) = 13.2 + 3.75 + 1.35, or about 18%. Both are better than the blended figures suggested, because the strongest segment is also the biggest one.
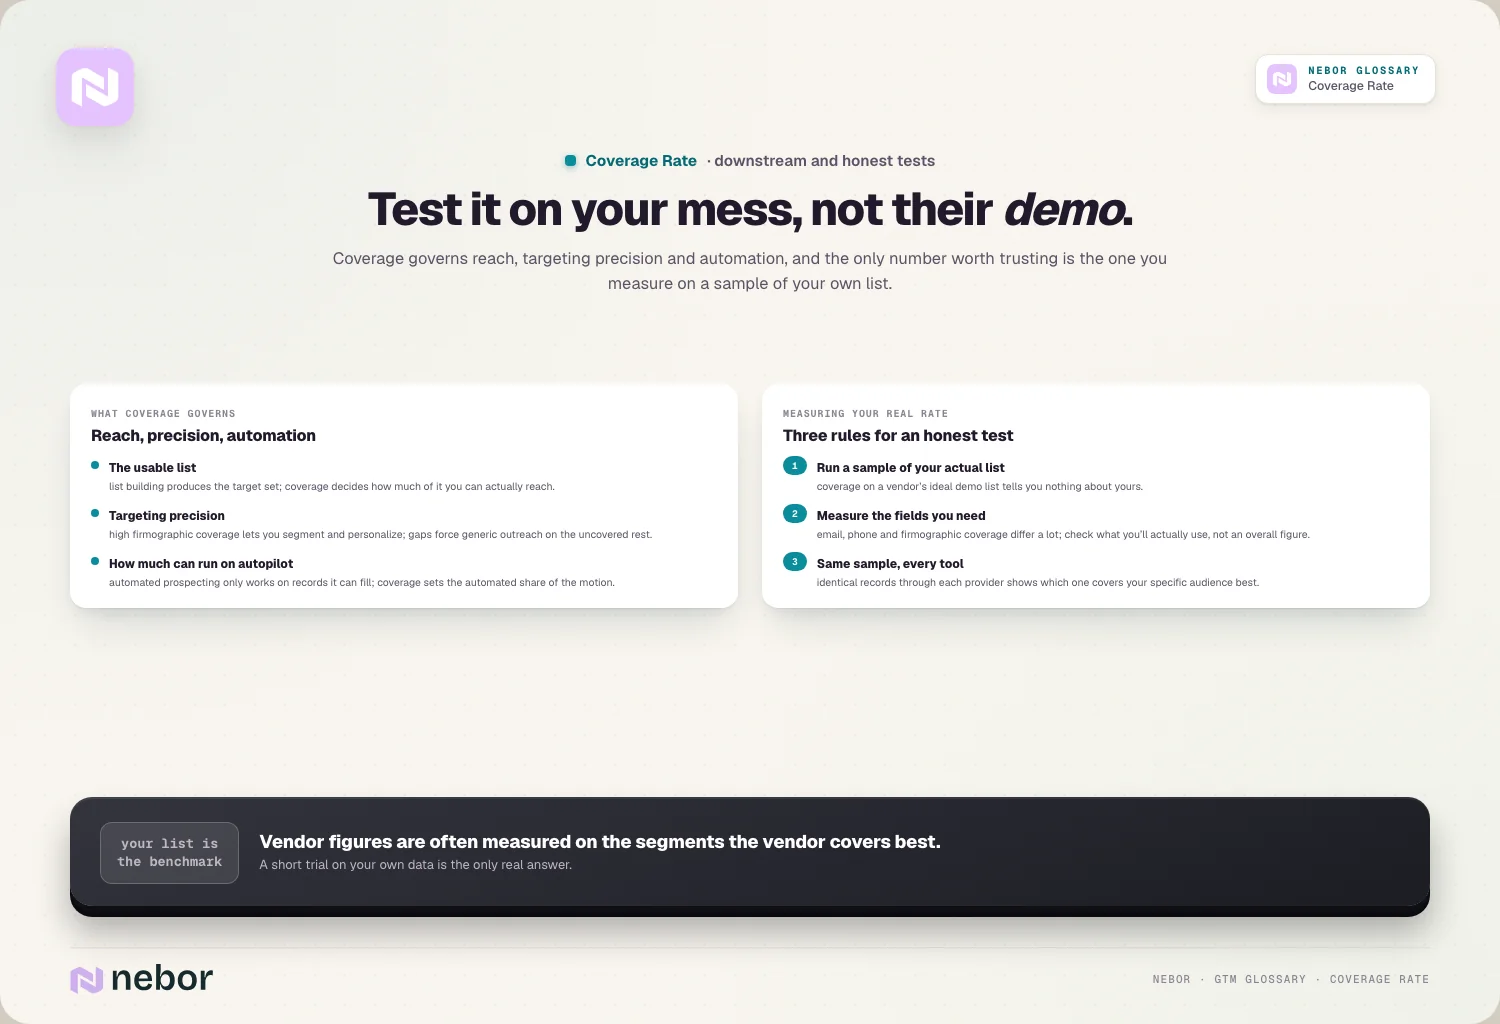
Check accuracy on the same records while you're at it, since you know the right answers, and keep results by provider so you can see their overlap. The rest of a provider trial, including cost per usable record, is covered under data enrichment and the data provider entry.
Raising coverage where it's thin
Once you know which cells are weak, the fixes are fairly specific.
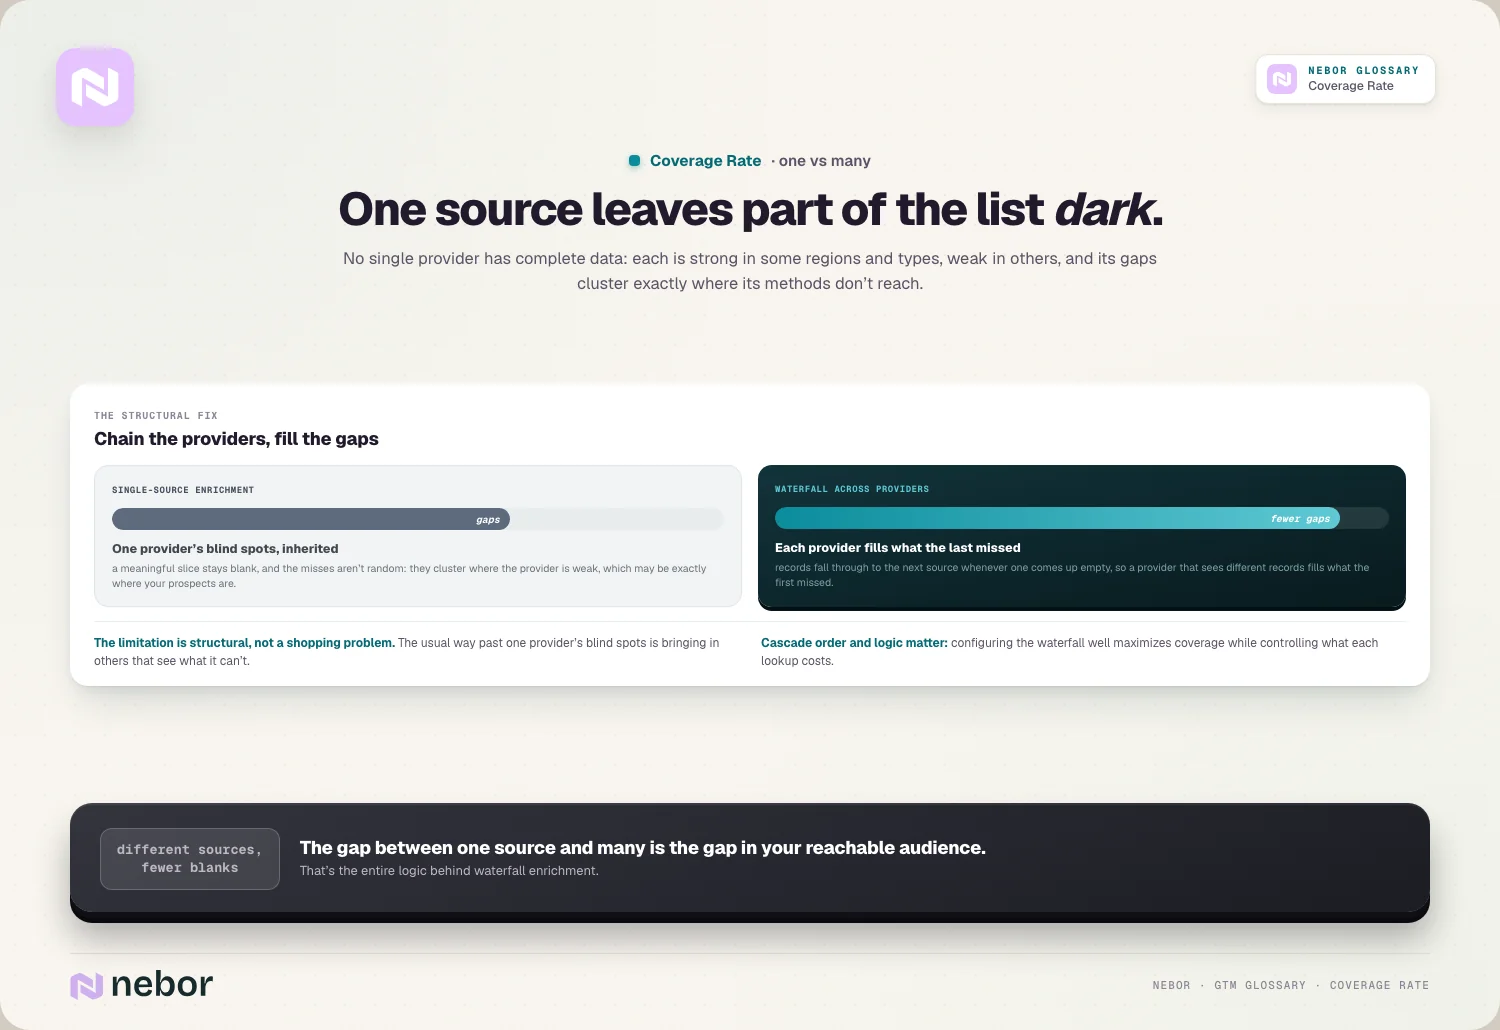
Add a second source only where it fills a different gap. A waterfall enrichment sends each record to the next provider only when the one before it comes up empty, so a provider that's strong in Belgium can sit behind one that's strong in the Netherlands without paying twice for the same Dutch records. Which provider goes first, when the cascade stops and how results get checked is the enrichment waterfall logic, and that's where most of the gain or waste happens. A second provider that misses the same Walloon HR managers as the first adds cost and no coverage.
Use registers and your own data for what they do well. Company names, activities, addresses and headcount bands can come from the KVK and the CBE, which removes the need to buy firmographic data you can get from the source. Contacts who filled in a form, attended an event or replied to a rep are covered by definition, and they're usually more accurate than anything bought, which is the practical side of choosing between data you collect yourself and data you buy.
Fix the search before you buy more data. Adding the Dutch and French title variants to your filters and rerunning the test costs less than a second contract.
Research the small, valuable cells by hand. If Wallonia is 450 accounts and a hundred of them are worth real effort, a researcher with LinkedIn Sales Navigator can find the right person faster than another provider can.
Plan channels around what you can find. With 9% direct dial coverage in Wallonia, a calling play there isn't a play. Email and LinkedIn carry that segment, and phone goes where coverage supports it. Coverage also limits how much of the motion can run without people: once you put prospecting on a schedule, the automation only ever reaches the records it can fill, which is the real size of the list your list building produced.
Then measure it again. Contacts move to new employers and companies get acquired or shut down, so a source that covered a segment well last year can be weaker now because of data decay, and providers change their own data over time. Keep the test file and rerun it before each renewal.
The bottom line
Coverage rate looks like a property of a database, and vendors sell it that way. In practice it's the share of your own list a tool can fill, and that share depends on where your list sits in the tool's map, which is why one headline figure can't tell you whether a provider will work for a team selling to Dutch and Belgian manufacturers.
The teams that get this right stop asking how big a database is and start asking how much of their own list it fills, cell by cell. They test on records they already know, check the market behind the list against an independent count, weight the result by where their accounts really are, and let the weak cells shape the channel plan instead of pretending they don't exist. It's the kind of groundwork the outbound practitioners worth learning from do before they write a single email, because every later step is capped by what the list can reach.
That number then feeds everything that runs on the data, from routing to sequencing, which is why it sits near the bottom of the systems a revenue team builds on its CRM. When a client wants to know how much of their list a provider really fills, we run this test with them, build the sources and filters into their Clay tables and CRM fields, and leave the test file behind so they can repeat it at the next renewal.
Frequently asked questions
Is coverage rate the same as match rate?
They are close, and many vendors use the two words for the same thing. Both describe the share of your list a tool returns data for. Match rate counts the records a provider recognized and returned anything for, while coverage rate is usually quoted for one field, such as verified emails found. Because a matched record can still lack the field you need, coverage for a single field is never higher than the match rate on the same list.
What is a good coverage rate for B2B contact data?
There is no figure that holds across markets. A rate that is excellent for Walloon HR managers would be weak for US software founders. The better test is whether coverage in each of your segments supports the play you plan to run there. If you need phone calls to work and dial coverage is under a fifth of the segment, the plan has to change, whatever the overall number says.
Why is direct dial coverage so much lower than email coverage?
Work emails can often be worked out from a company's address pattern and then checked by a verifier, so providers can produce them at scale. Direct dials and mobile numbers rarely appear anywhere public. Providers get them from contributors who share their contacts or from teams that call numbers to confirm them, which is slower and more expensive, so far fewer records end up with a working number.
Does a high coverage rate mean the data is accurate?
No. Coverage says a value came back, not that it is right. A provider can return an email for almost every record and still be wrong on a large share, because people moved jobs or the address was guessed. Count a record as covered only after the email passes verification or the title is checked, and test accuracy on records where you already know the correct answer.
Can you trust the coverage figure on a vendor's website?
Treat it as a claim about the vendor's own database, measured the way the vendor chose. It is usually divided by the records the provider already holds, often for the segments it covers best, which is not your market. It may still be honest. It just answers a different question from yours, which is how many of the specific companies and people you sell to the source can return.
Is company coverage usually higher than contact coverage?
Usually, yes. Company facts like name, industry, address and rough headcount are close to public, and in the Netherlands many of them sit in the national business register. Named people are harder, especially below senior level, and their details change whenever they switch jobs. That is why a provider can hold most companies in your market and still have the right contact at far fewer of them.
What can you do when no provider covers a segment well?
First check your filters, since missing Dutch or French title variants often look like missing data. Then use what the market itself provides: registry data for the companies, research by hand for the few accounts worth the effort, and first-party contacts from events, forms and replies. Finally, choose channels that work with what you have, such as email and LinkedIn where phone numbers are scarce.
Does the GDPR stop providers from holding European business contacts?
No. The GDPR accepts that direct marketing can be a legitimate interest, provided the interest is weighed against the person's rights. It does treat a named work email as personal data, so providers must be able to justify holding it, honour objections and tell people where their data came from. That extra work is one reason a provider's European data can differ from its US data.
Does adding more providers always raise coverage?
Only when the new provider finds records the others missed. Two providers built from similar sources tend to fail on the same people, so the second adds cost and little else. Before adding a source, compare the overlap on a test file of your own records. The most useful extra provider is often a narrower one that is strong in exactly the segment where your first source is weakest.
Share this post
Data
Enrichment
Glossary
Related glossary items
Understanding the core GTM concepts




Ready to build your pipeline