

In this post:
Most teams track one conversion rate, like leads to customers, and treat it as a single number to improve. That number tells you something is wrong, but it never tells you where, which is the information you need most.
The truth is that your pipeline leaks at specific stages, and the leaks are rarely where you'd guess. A healthy-looking overall rate can hide one stage where most of your deals disappear without a trace.
Pipeline conversion rate is the percentage of prospects that move from one stage of your sales pipeline to the next, measured both stage by stage and across the whole funnel. It shows how efficiently deals progress toward closing.
The reason the stage view matters is that a single conversion number is an average that hides the story. Breaking it down by stage shows you exactly where prospects fall out, which is the only way to fix the right thing.
TL;DR
Pipeline conversion rate measures the share of prospects that advance from one pipeline stage to the next, and overall from lead to closed deal. It reveals how efficiently your funnel turns interest into revenue.
The stage-by-stage view shows where deals leak. A single overall rate hides the specific bottleneck, while the breakdown points you straight to the stage costing you the most.
Benchmarks vary, but overall lead-to-customer rates are often low, with the steepest drop usually at the MQL-to-SQL handoff. Knowing your own stage rates matters more than any benchmark.
The framing to hold is that conversion rate is diagnostic instead of a goal in itself. The point is to find and fix the weak stage, without chasing a vanity number that hides where the real problem is.
So what is pipeline conversion rate, and what does it map for you?
Pipeline conversion rate measures how well prospects move through your sales pipeline. At its simplest, it's the percentage of people at one stage who advance to the next.
It works at two levels at once. There's the overall rate, from first lead to closed deal, and the stage rates, like lead to qualified, qualified to opportunity, and opportunity to close.
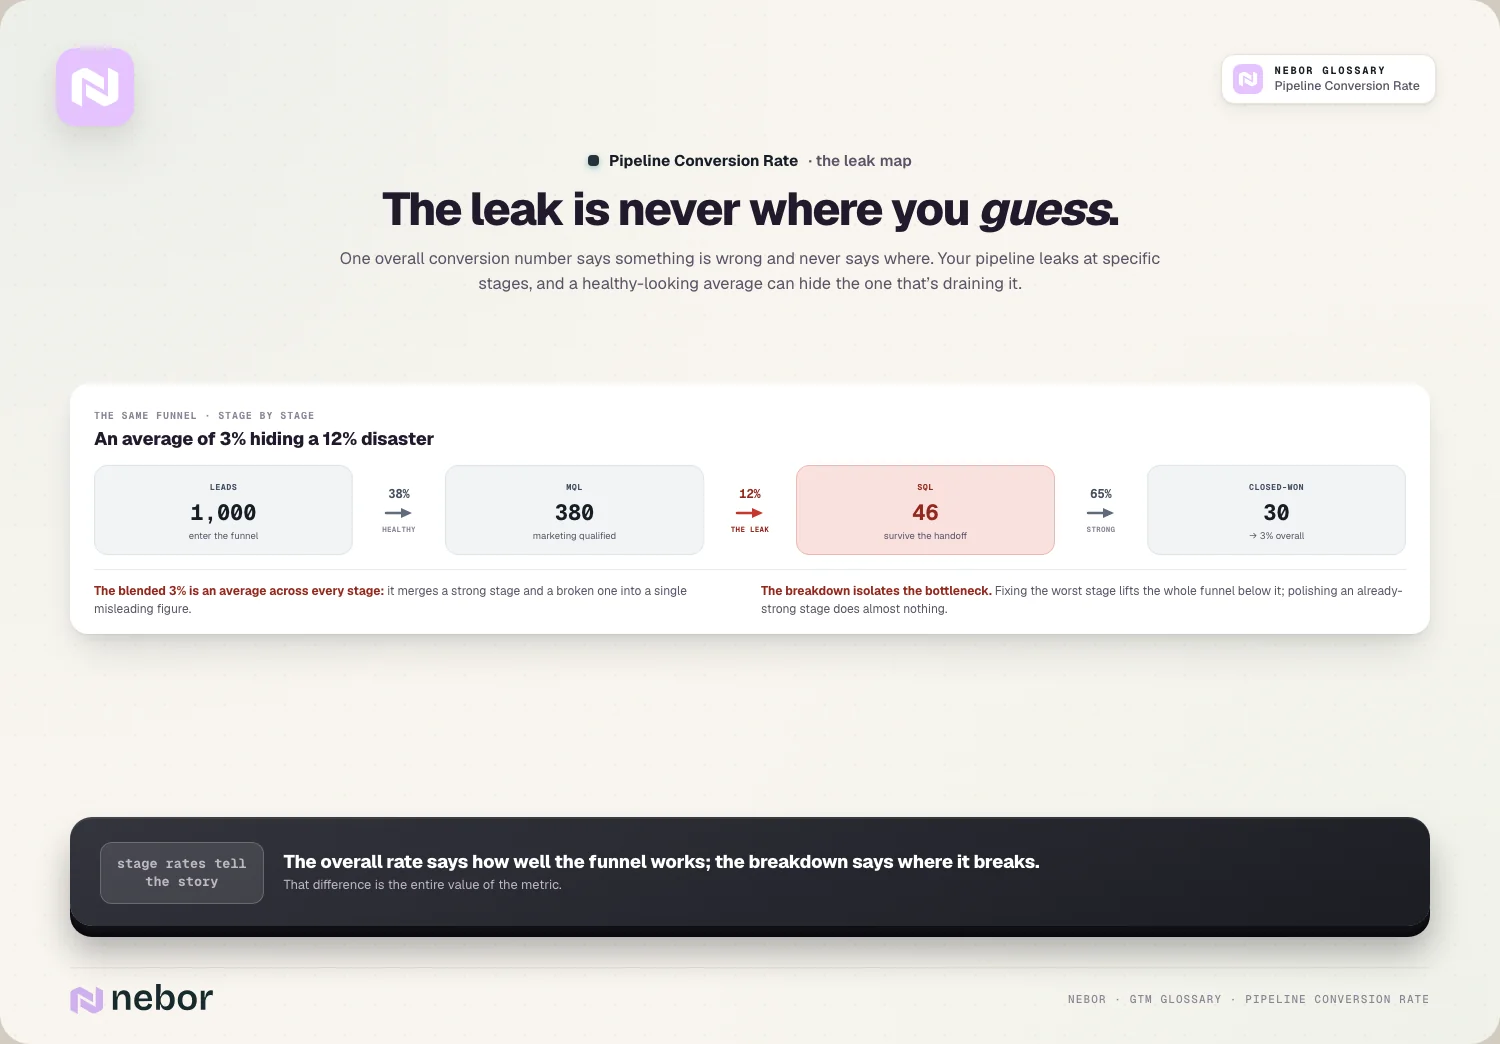
The overall rate tells you the funnel's total efficiency. If 100 leads enter and 3 become customers, your overall conversion rate is 3%, which is the single headline number most teams end up watching.
The stage rates tell you the story behind it. Each transition has its own rate, so you can see where prospects advance smoothly and where they pile up and drop out.
So pipeline conversion rate is really a map of your funnel's health. The overall number says how well it works, and the stage breakdown says where it works and where it breaks.
Why does the stage breakdown matter more than the overall rate does?
The breakdown beats the single number for a reason worth tracing, because an average hides exactly what you need to know.
A single conversion rate is an average across every stage. It tells you the funnel underperforms, but it blends a strong stage and a broken one into one misleading figure.
The breakdown is what isolates the leak, because when you see each stage's rate, one usually stands out as far worse than the others, and that's the bottleneck draining your pipeline.
Fixing the right stage is what moves results. Improving a stage that's already strong does little, while fixing the worst one can lift your whole funnel, because every later stage depends on it.
So the breakdown turns a vague problem into a specific one. Instead of trying to improve everything at once, you find the single stage that's costing you most and fix that first, which is far more effective.
Where do B2B pipelines usually leak, and where should you look first?
Knowing the common leak points helps you find yours faster, and in our experience a few stages are the usual culprits.
The most common bottleneck is the qualification handoff. The MQL-to-SQL transition often shows the steepest drop, as marketing-qualified leads fail to become sales-qualified ones.
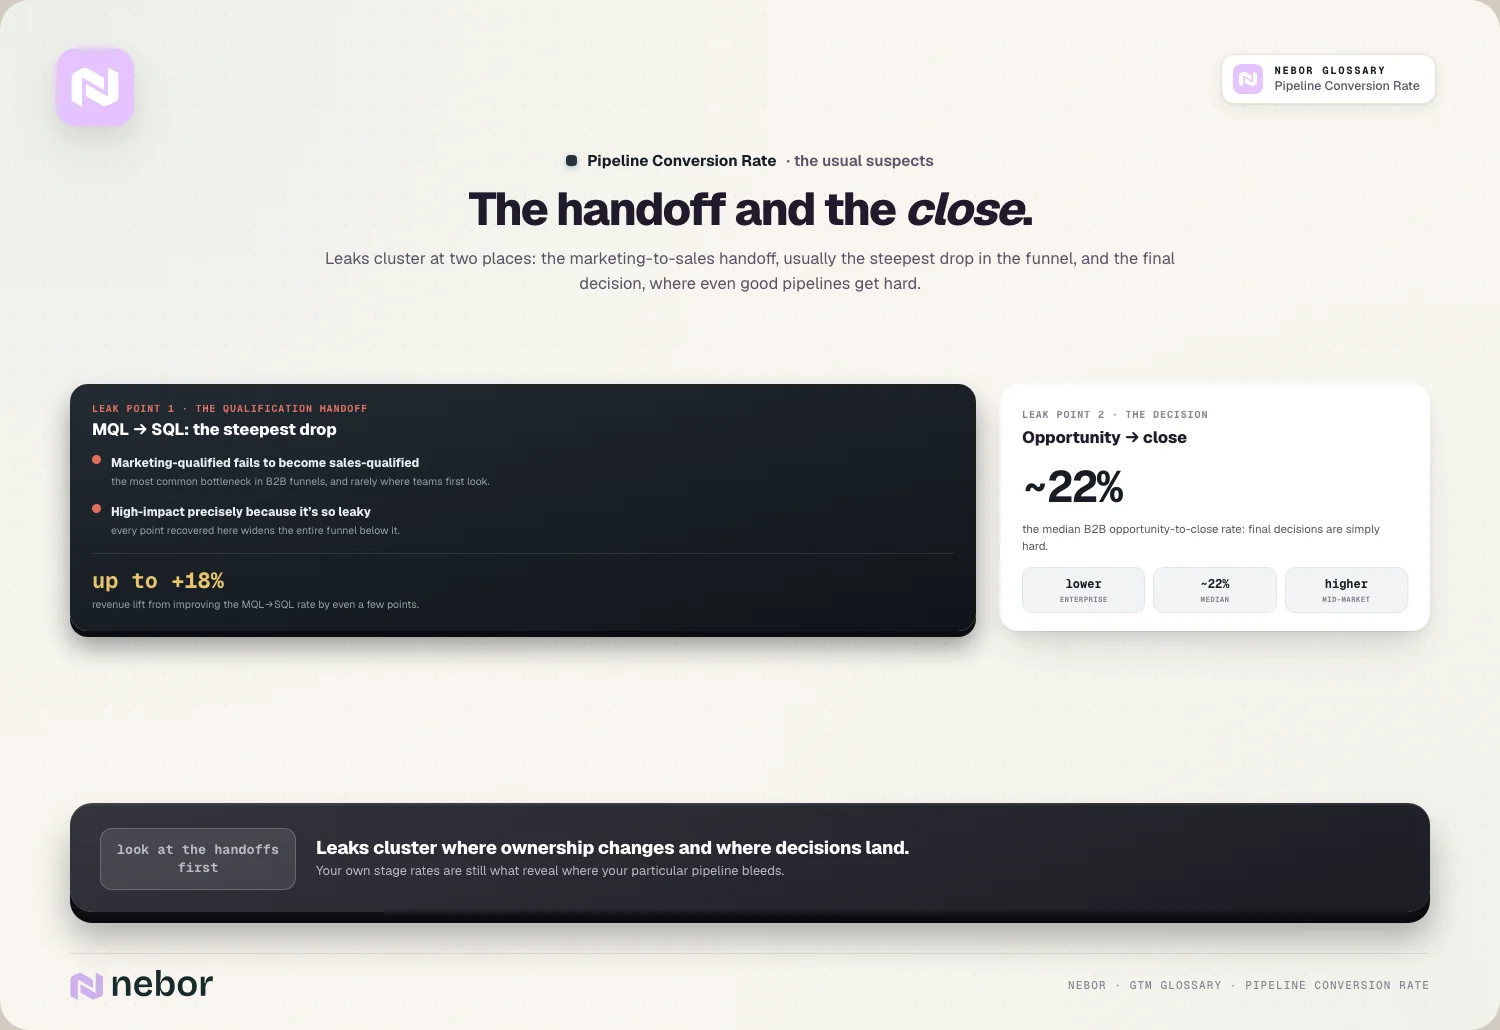
That stage is high-impact precisely because it's so leaky. Improving the MQL-to-SQL rate by even a few points can lift revenue by up to 18%, since it widens the whole funnel below it.
The opportunity-to-close stage is another frequent offender. The median B2B opportunity-to-close rate is around 22%, with enterprise lower and mid-market higher, reflecting how hard final decisions are.
So leaks cluster at the handoffs and the close. Knowing this tells you where to look first, though your own stage rates are always what actually reveal where your particular pipeline bleeds.
How is conversion rate different from the win rate you already track?
These two metrics get confused, so it helps to separate them. They measure different things at different points.
Win rate measures the final stage only, as the percentage of opportunities that become closed-won deals, focused entirely on how well you close what you're actively working.
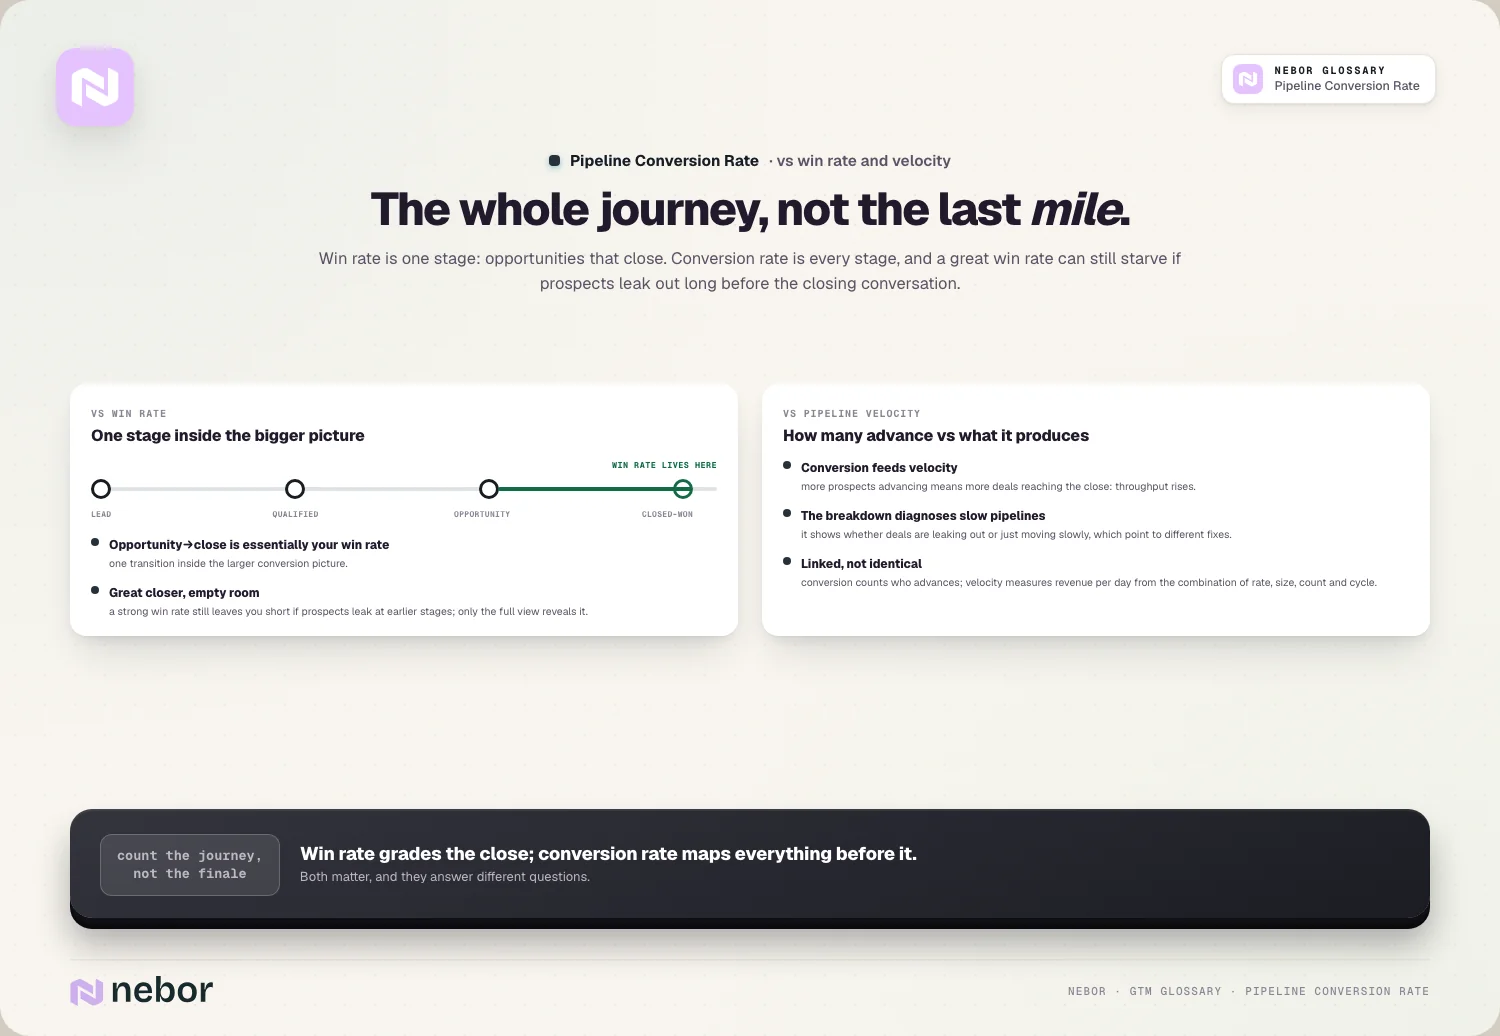
Pipeline conversion rate is broader, measuring movement through every stage of the journey, so it captures where prospects drop out long before the closing conversation.
The two connect at the end of the funnel, because your opportunity-to-close conversion rate is essentially your win rate, which is one stage inside the larger pipeline conversion picture.
So win rate is a single stage and conversion rate is the whole journey. A great win rate can still leave you short if prospects leak out at earlier stages, which only the full conversion view ever reveals to you.
How does conversion rate relate to the pipeline velocity above it?
Conversion rate is one of the inputs into how fast your pipeline produces revenue, so it connects directly to velocity, and the two are easiest to understand together.
Pipeline velocity combines several factors, including win rate, deal size, opportunity count, and cycle length, into revenue per day. Conversion rate feeds the win-rate and progression parts of that.
Better conversion lifts velocity directly, because when more prospects advance through each stage, more deals reach the close, which raises the throughput of the whole pipeline.
The stage view helps diagnose velocity problems too, because if your pipeline is slow, the conversion breakdown shows whether deals are leaking out or just moving slowly, which points to different fixes.
So conversion rate and velocity are linked but distinct. Conversion measures how many advance, velocity measures how much revenue that produces over time, and improving conversion is one lever on velocity.
How do you improve a weak conversion stage once you've found it?
Once the breakdown reveals your worst stage, the question is how to fix it. The right fix depends on which stage is leaking.
If the qualification handoff leaks, the issue is often fit, and sharpening lead scoring and your fit score versus intent score keeps poorly-fit leads from clogging the funnel and dropping out later.
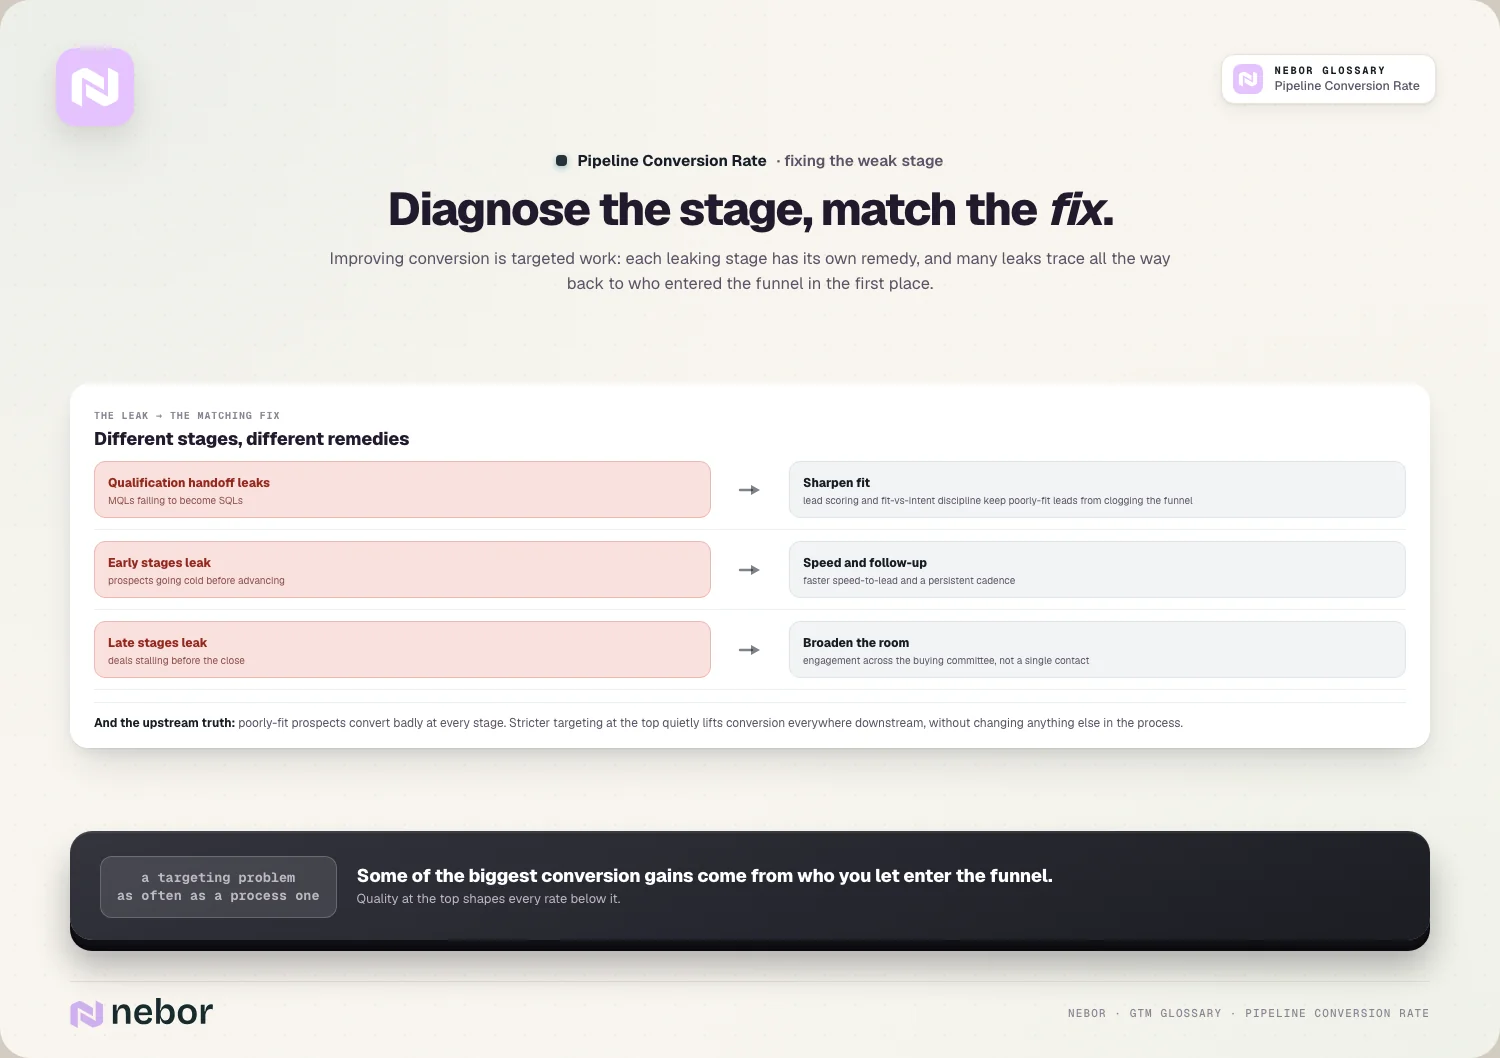
If early stages leak, speed and follow-up matter most, because faster response through speed to lead and a persistent sales cadence keep prospects from going cold before they advance.
If late stages leak, it's often about the buying group, because deals that stall before closing frequently need broader engagement across the buying committee rather than a single contact.
So improving conversion turns out to be targeted work, where you diagnose the leaking stage and then apply the fix that addresses that specific stage instead of treating the whole funnel the same.
How does targeting upstream shape your conversion rates downstream?
A subtle truth about conversion rates is that many leaks trace back to who entered the funnel. Quality at the top shapes conversion all the way down.
Poorly-fit prospects convert badly at every stage, because if you let weak leads into the funnel, they drop out later, dragging down your conversion rates no matter how good your process is.
Better targeting lifts conversion across the board, because when the prospects entering the funnel genuinely fit, more of them advance at each stage, which raises your rates without changing anything else.
This is why qualification and scoring matter so much. A predictive lead scoring model that keeps the funnel full of good-fit prospects improves conversion everywhere downstream at once.
So conversion is a targeting problem as much as a process one. Some of the biggest conversion gains come from being stricter about who you let enter the funnel in the first place.
How does attribution help you read your conversion rates properly?
Conversion rates tell you where prospects drop, but not always why, which is where attribution comes in. The two work together to give a full picture.
Multi-touch attribution shows which touches and channels move prospects through stages. That reveals whether a leak is about the channel, the message, or the timing.
It protects good stages too, because attribution can show that a touch which rarely gets the final credit is what advances prospects through a key stage, so you don't cut it by mistake.
Together they diagnose more precisely, because conversion rate shows the leaking stage, and attribution helps explain what's causing the leak, which makes the fix more accurate.
So conversion rate and attribution are complementary diagnostics. One finds where deals fall out, the other helps explain why, and using both turns a symptom into a root cause.
How does conversion rate apply to outbound as well as inbound?
Conversion rate is often discussed in inbound funnel terms, but it applies just as much to outbound. The stages just look a little different.
An outbound funnel has its own progression, where contacts reached become replies, replies become meetings, meetings become opportunities, and opportunities become deals, each with its own conversion rate.
The early outbound stages carry their own metric, because your reply rate is essentially the first conversion in outbound, from contacts reached to people who respond.
The same diagnostic logic applies to all of it, because if outbound underperforms, the stage breakdown shows whether the problem is replies, meetings, or closing, which each point to very different fixes.
So outbound deserves treating as a funnel with conversion rates too. Whether a prospect came from inbound or outbound, breaking the journey into stages shows you exactly where they fall out.
How does conversion rate help you forecast what's coming next?
Beyond diagnosis, conversion rates are a forecasting tool. Knowing your stage rates lets you predict outcomes from what's in the funnel now.
Stable conversion rates make pipeline predictable, because if you know what share of opportunities typically close, you can estimate revenue from your current pipeline with reasonable confidence.
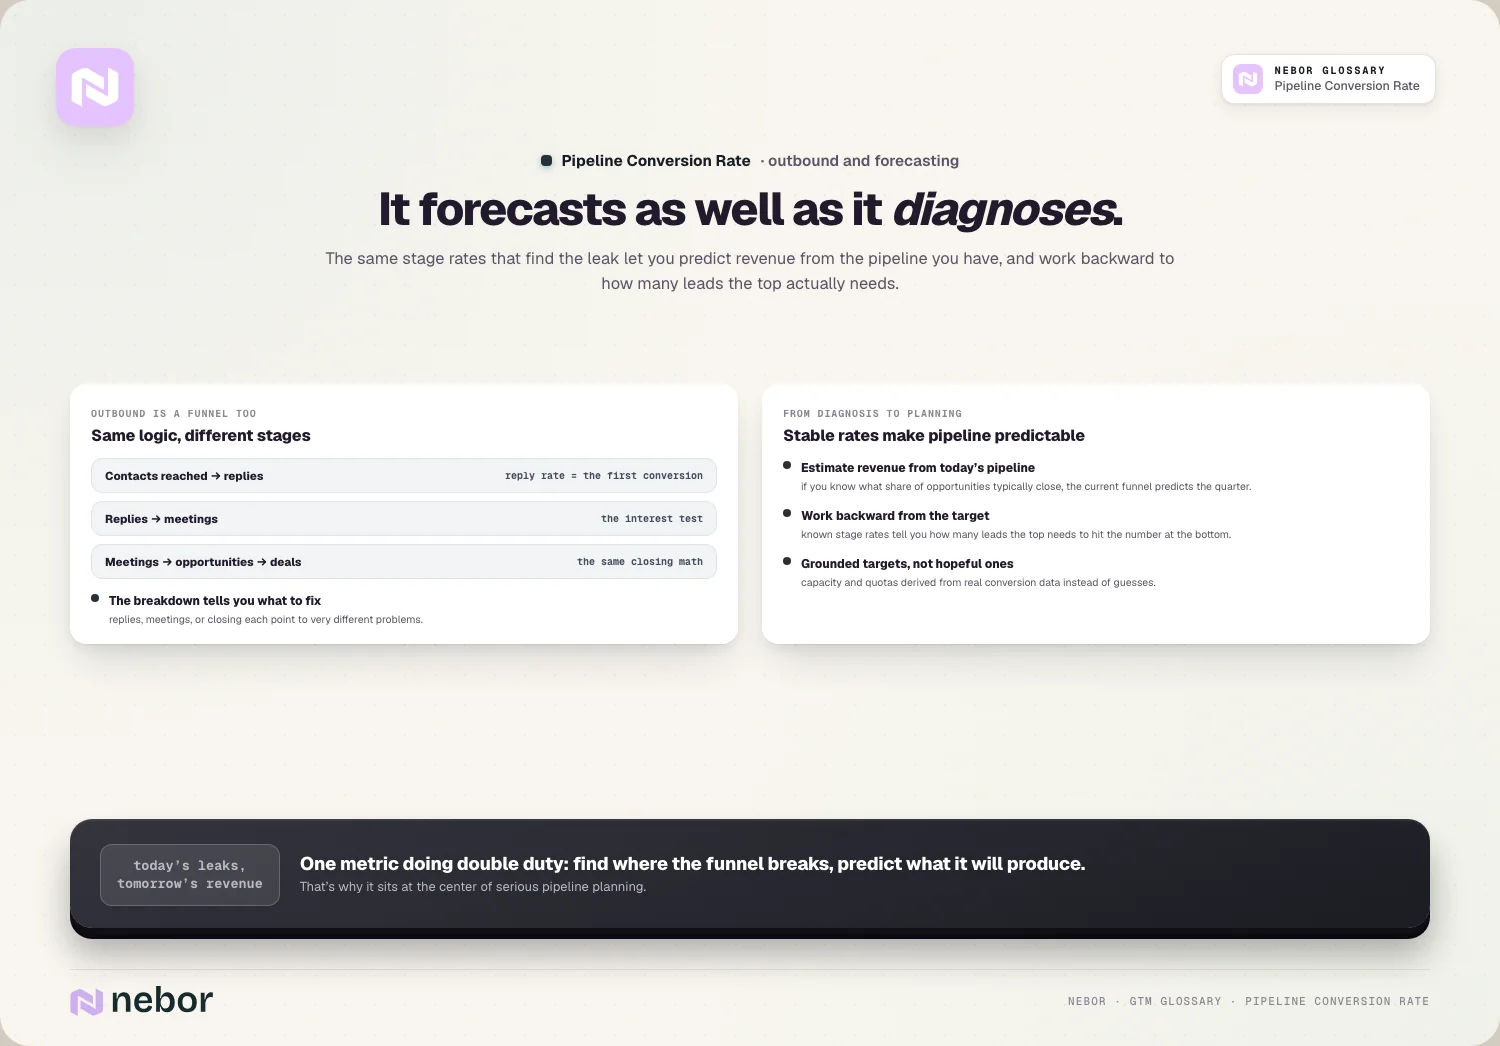
They let you work backward too, because if you know your stage rates, you can calculate how many leads you need at the top to hit a revenue target at the bottom.
This turns conversion data into real planning, because instead of guessing how much pipeline you need, you derive it from your real conversion rates, which makes targets and capacity grounded rather than hopeful.
So conversion rates do double duty for any revenue team. They diagnose where the funnel leaks today and forecast what it will produce tomorrow, which is why they are at the center of serious pipeline planning.
What are the common mistakes teams make with pipeline conversion rate?
Conversion rate gets misused in a few predictable ways we keep seeing in the CRMs we audit, and avoiding them is what keeps the metric useful.
Watching only the overall rate tops the list, because a single number hides the leaking stage, so tracking just the headline figure tells you there's a problem without showing where.
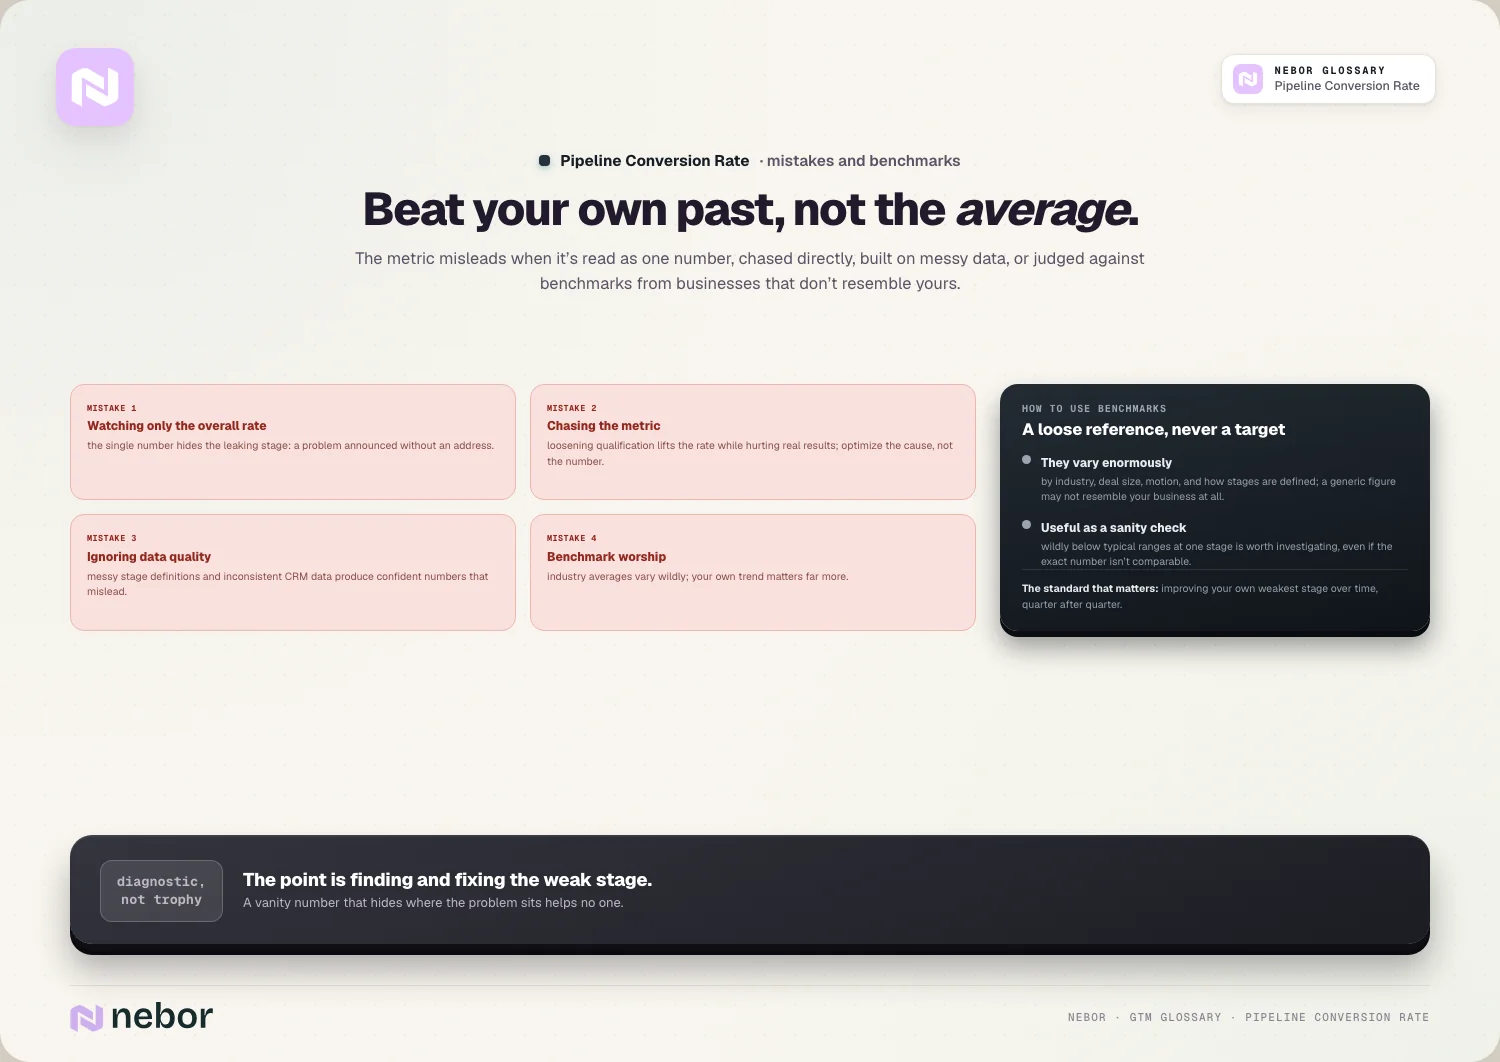
Chasing the metric instead of the cause comes next, because optimizing a conversion number directly, like loosening qualification to pass more leads through, can lift the rate while hurting real results.
Ignoring data quality undermines it all, because conversion rates built on messy stage definitions or inconsistent CRM data produce confident numbers that mislead rather than guide.
And there's comparing to benchmarks instead of yourself, because industry benchmarks vary widely, so your own stage rates over time matter far more than a generic average.
Should you compare your conversion rates to industry benchmarks at all?
Benchmarks are tempting, but they're easy to misuse, and we point clients to a simple rule about how much weight to give them.
Benchmarks vary enormously in the first place, because conversion rates differ by industry, deal size, motion, and how you define your stages, so a generic benchmark may not resemble your business at all.
They're useful as a rough sanity check, because if your rate at a stage is wildly below typical ranges, that's a signal worth investigating, even if the exact number isn't comparable.
But your own trend matters more in the end, because whether your conversion rate at each stage is improving over time tells you far more than how you stack against an average from a different kind of company.
So benchmarks work as a loose reference instead of a target. The goal is to beat your own past performance and fix your weakest stage, which is a far more useful standard than a generic industry figure.
Why the breakdown, and never the average, is where the answers live
Pipeline conversion rate matters because it shows not just whether your funnel works, but where it breaks. The stage-by-stage view turns a vague sense that you're losing deals into a precise map of where they leak.
The deeper point is that a single conversion number is an average that hides the story. The real value lives in the breakdown, which points you to the one stage costing you the most.
The honest framing is that conversion rate is a diagnostic instead of a goal. The aim is to find and fix the weakest stage, and often to fix it upstream by being stricter about who enters the funnel.
So if you only watch one conversion number, you're flying blind to where your pipeline really bleeds. Breaking it down by stage and fixing the worst one is how you turn a leaky funnel into an efficient one.
That kind of stage-level diagnosis is exactly what a modern go-to-market system is built to support. It matters even more once you automate sales prospecting, since you need to know which stage to improve before you scale volume into it.
Share this post
RevOps
Glossary
Related glossary items
Understanding the core GTM concepts




Ready to build your pipeline