

In this post:
Your recurring revenue grew from ten million to twelve million over the year, which on the surface looks like a clean two-million win. What it hides is everything underneath, because the same result could come from a healthy business adding customers or a shaky one outrunning the customers it keeps losing.
A revenue waterfall exists to pull that story apart. Instead of showing only where revenue started and ended, it lays out every force that moved it in between, so you can see whether the growth came from new business, existing customers expanding, or simply outpacing the churn draining out the bottom.
A revenue waterfall is a chart that connects your starting revenue for a period to your ending revenue by breaking out each component that added to or subtracted from it, typically new business, expansion, contraction, and churn. It turns a net change into a full account of how that change happened.
Finance teams lean on it because net growth alone is close to useless for decisions. Two companies with identical top-line growth can have completely different health underneath, and the waterfall is what makes that difference visible instead of leaving it buried in a single figure.
TL;DR
A revenue waterfall connects starting revenue to ending revenue by breaking out every component that moved it, so new business, expansion, contraction, and churn each get their own column instead of collapsing into one net number.
It exists because net growth hides the mechanics, and two companies growing at the same rate can be healthy or leaky depending on whether that growth comes from durable expansion or from new deals outrunning heavy churn.
The same term covers two related charts, the ARR bridge that decomposes growth by type and the bookings-to-revenue waterfall that shows how signed contracts convert to recognized revenue over time, and the two get confused constantly.
Reading one well tells you whether your growth is efficient, because a waterfall that leans on retention and expansion is far sturdier than one propped up entirely by new logos replacing churned ones.
What a revenue waterfall shows you about how your ARR moved and why
At its simplest, a revenue waterfall answers a question a growth number can't, which is how you got from the revenue you started with to the revenue you ended with. It anchors your starting figure on the left, stacks the movements through the middle, and lands on your ending figure at the right.
The middle columns are where the real information lives, because each one represents a distinct force. New business pushes the total up, expansion pushes it up further, contraction pulls it back down, and churn pulls it down more, so the ending number is the sum of opposing pressures instead of a single trend.
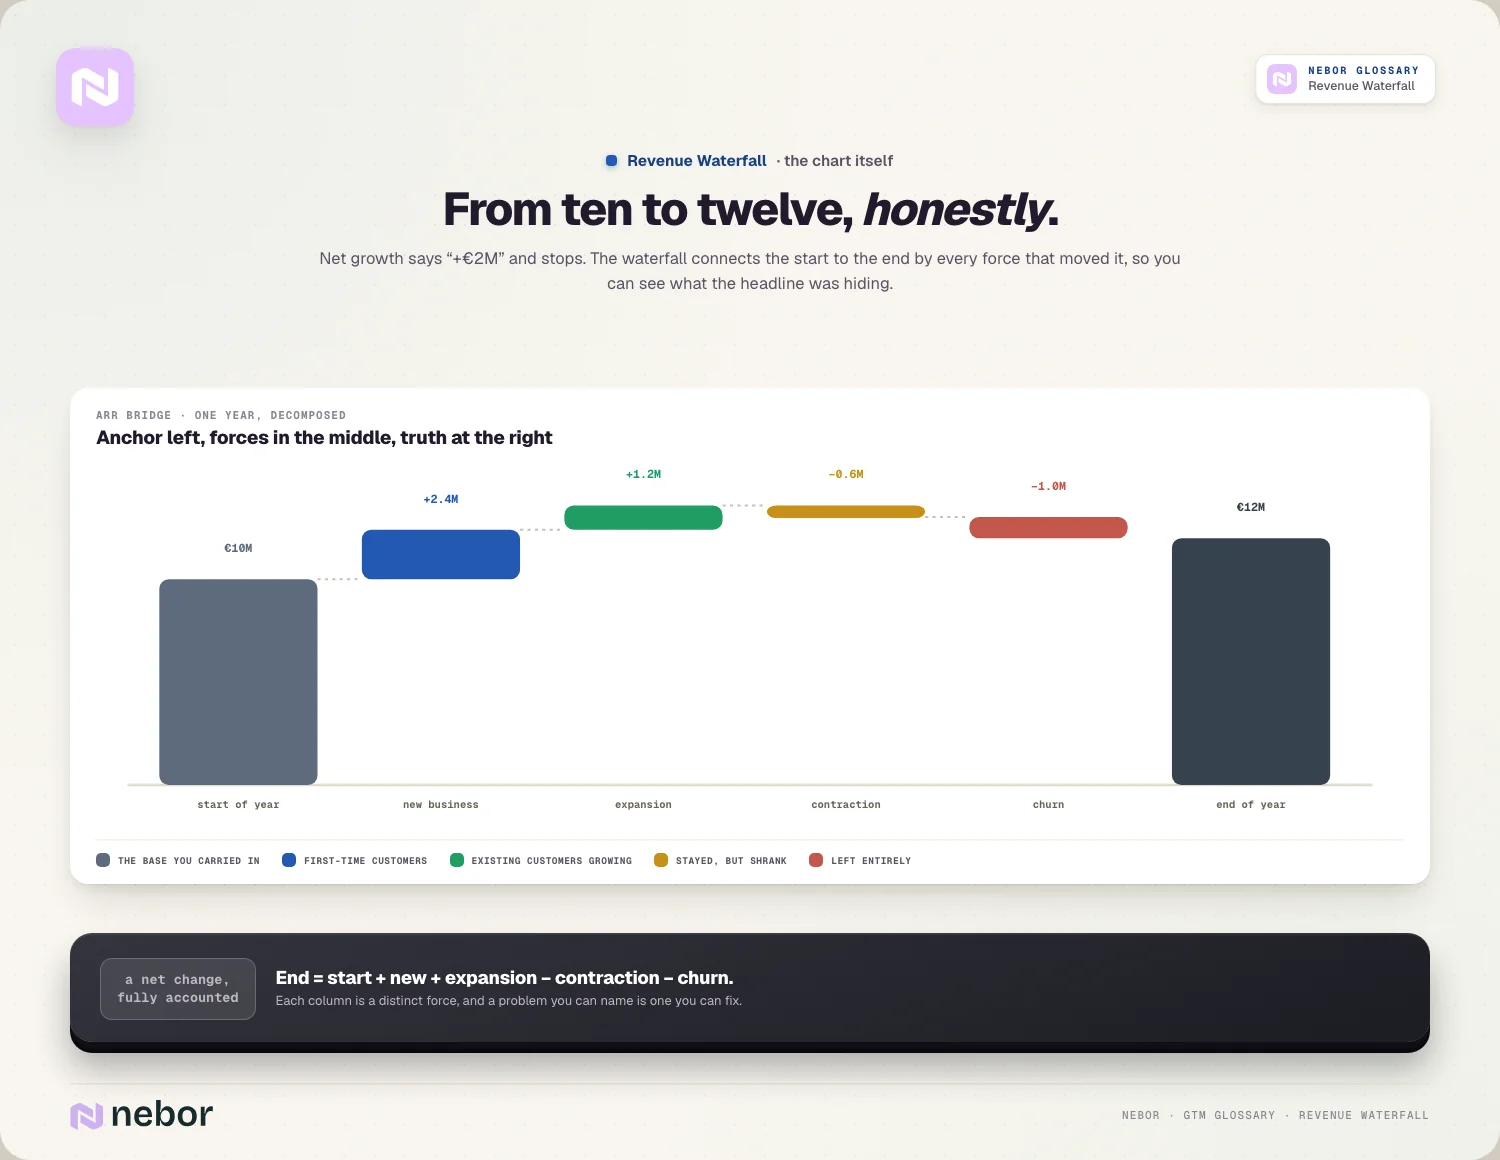
Seeing those forces separately changes what you can do about them, because a problem you can name is one you can fix. A waterfall showing healthy new business but heavy churn tells you to protect the base, while one with strong retention but thin new business tells you to feed the top of the funnel.
Why a single net growth number hides everything that matters most
The core problem with net revenue growth is that it averages forces moving in opposite directions, and averages conceal what you need to see. A company adding four million while losing two million to churn shows the same net gain as one adding two million and losing nothing, yet those are very different businesses.
The difference between them is durability, and it only shows up when you separate the flows. Growth built on retaining and expanding customers compounds year after year, whereas growth built on replacing churned customers is a treadmill that gets harder to sustain as the base you have to replace keeps getting bigger.
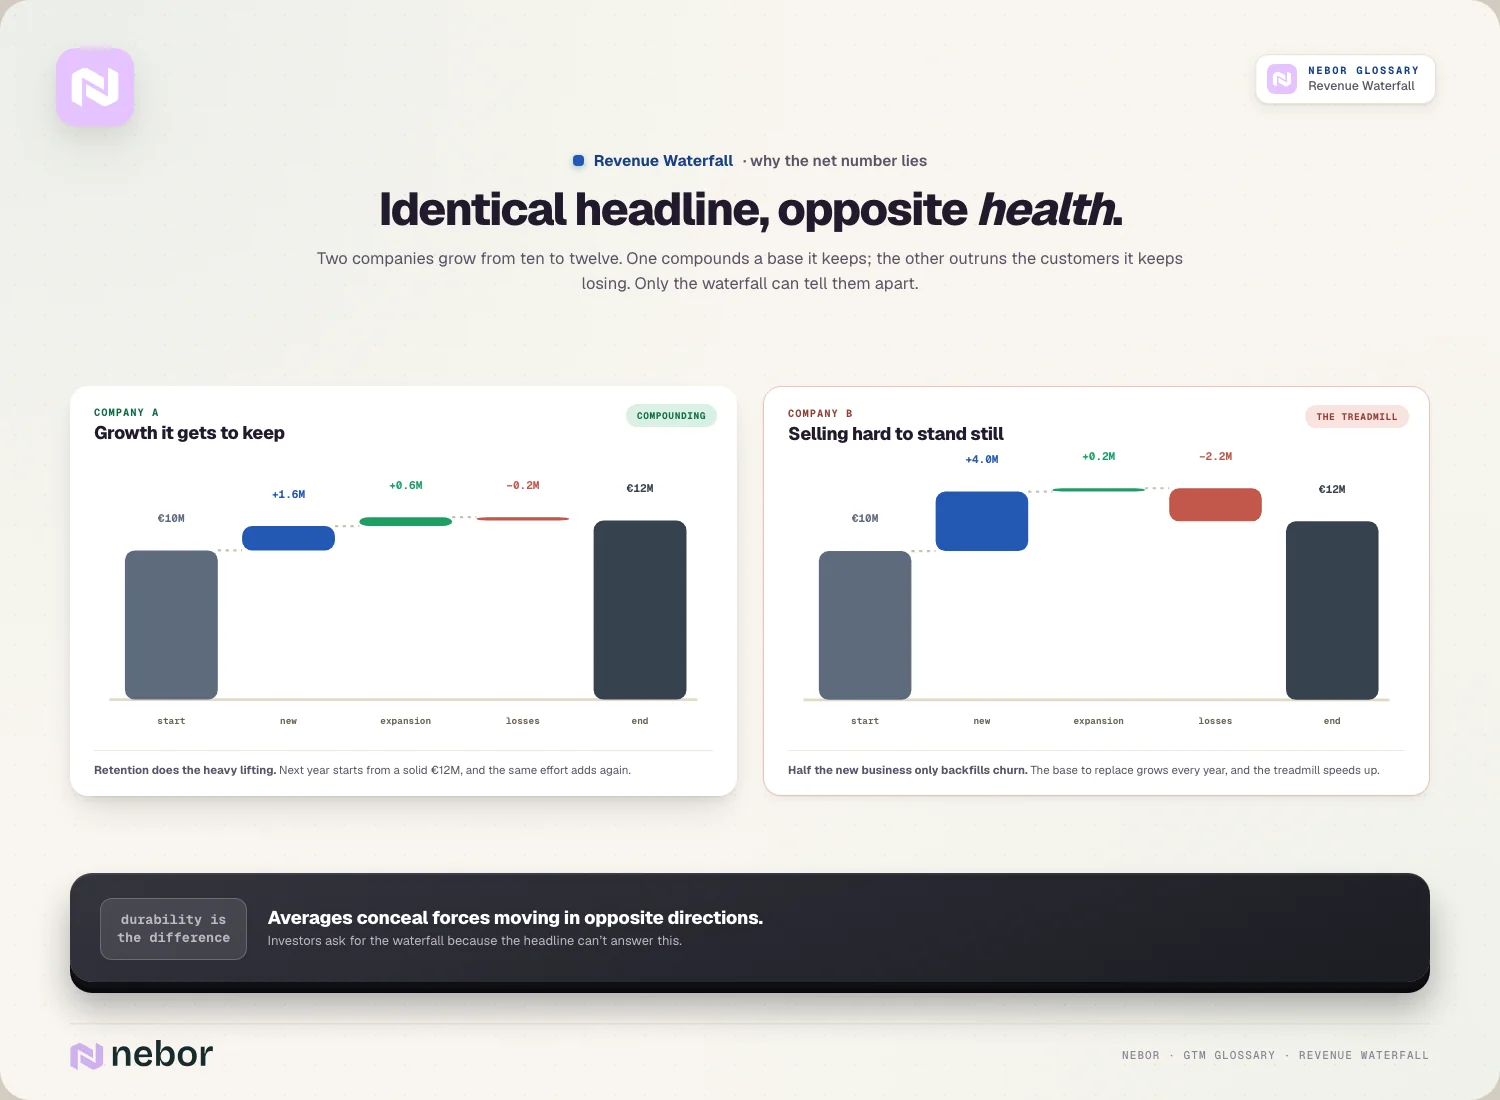
This is why investors and boards ask for the waterfall instead of the headline. They know a business leaking customers can post respectable growth for a while by selling hard enough to cover the losses, and the waterfall is the one view that exposes whether the engine is truly healthy.
The building blocks of an ARR bridge and what each column represents
The most common form of revenue waterfall is the ARR bridge, which decomposes a period's growth in annual recurring revenue into a handful of standard components. It begins with your starting ARR, the recurring revenue you carried into the period, which forms the anchor everything else builds from or erodes.
From there, the positive columns capture the revenue you gained. New ARR comes from customers who signed for the first time, and expansion revenue comes from existing customers who upgraded tiers, added seats, or grew usage, and together these two are the engines pushing the total upward.
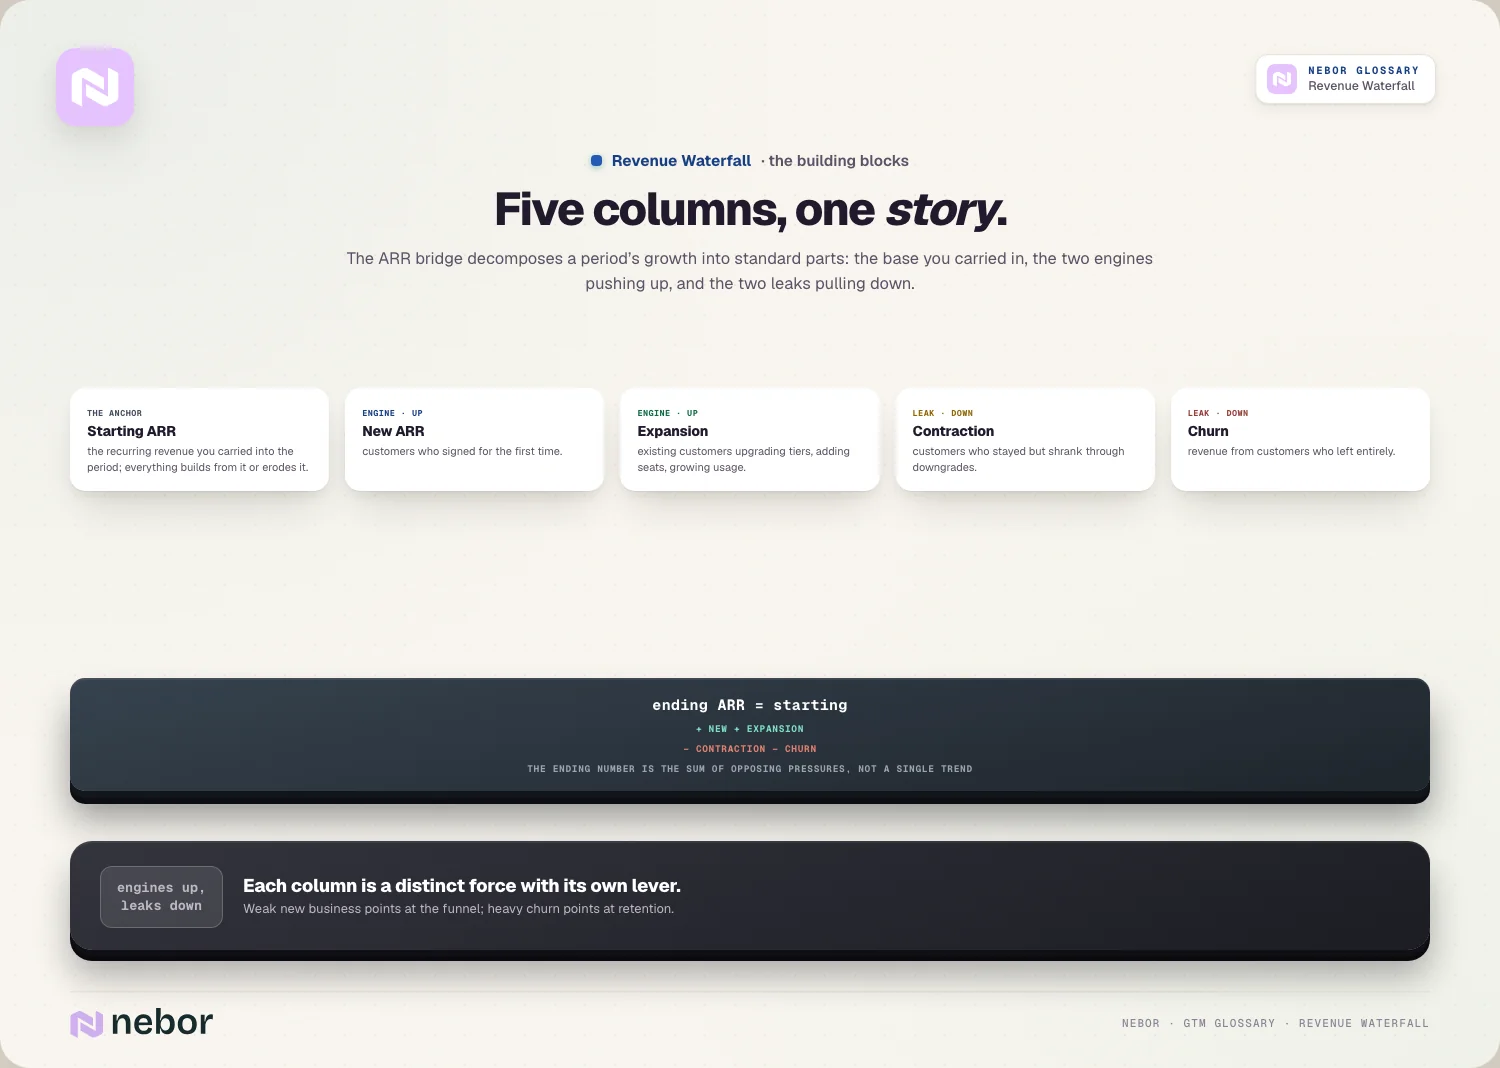
The negative columns capture what you lost, split into two distinct kinds. Contraction is revenue lost from customers who stayed but shrank through downgrades, while churn is revenue lost from customers who left entirely. Your ending ARR is starting plus new and expansion, minus contraction and churn.
How the bookings-to-revenue waterfall is a different chart people confuse with this one
The term revenue waterfall carries a second meaning, because it can also describe a bookings-to-revenue waterfall. That version shows how signed contracts convert into recognized revenue over time, following the accounting rules that spread a booking across the contract's months instead of counting it all at signing.
The distinction comes down to what each chart tracks.
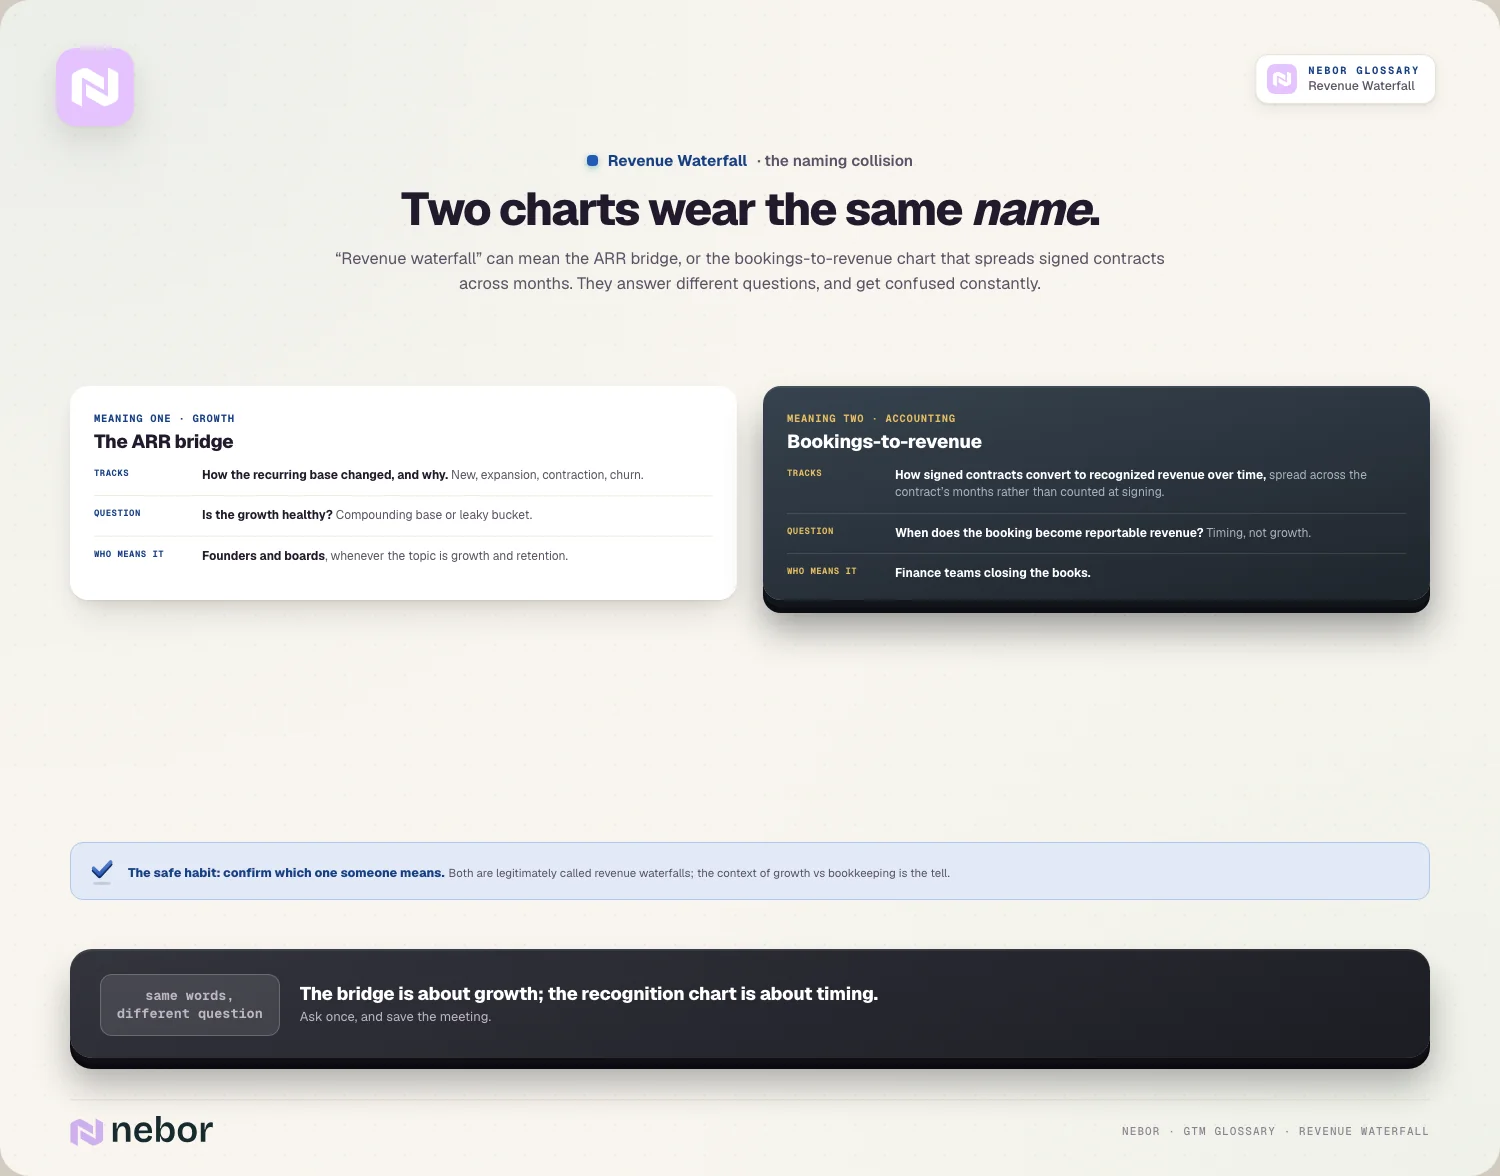
The ARR bridge tracks how the size of your recurring base changed and why, while the bookings-to-revenue waterfall tracks the timing gap between selling something and reporting it as recognized revenue, a question about accounting instead of growth, as The SaaS CFO lays out.
Both are legitimately called revenue waterfalls, so the safest habit is to confirm which one someone means. When a founder or board talks about the waterfall in the context of growth and retention, they almost always mean the ARR bridge, whereas finance teams closing the books usually mean the recognition waterfall.
Why expansion and contraction deserve their own columns instead of being netted
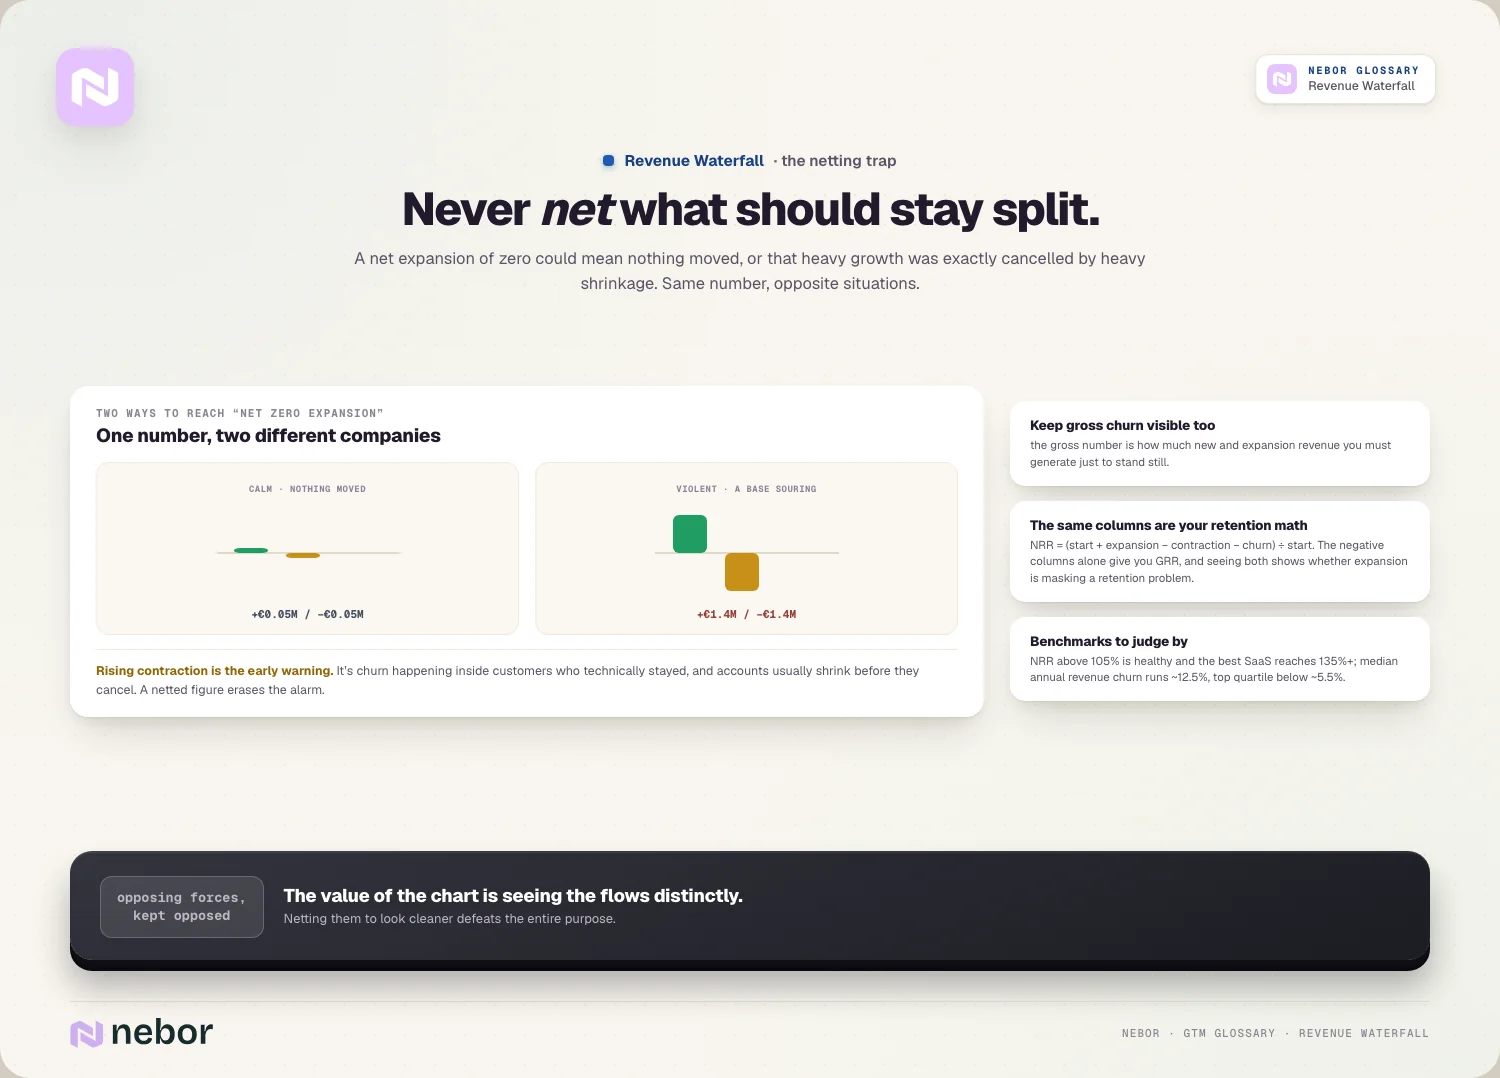
A tempting shortcut is to combine expansion and contraction into a single net column, but that throws away information you need. A net expansion of zero could mean nothing moved, or that heavy expansion was exactly cancelled by heavy contraction, and those are opposite situations behind one number.
Keeping them separate reveals the churn happening inside customers who technically stayed. Contraction is quieter than outright churn, because the customer is still on the books, but a rising contraction column is often the early warning that accounts are souring before they cancel, which a netted figure would erase.
The same logic applies to keeping gross churn visible instead of folding it into net retention. You want to see the full revenue leaving through cancellations on its own, because that gross number tells you how much new and expansion revenue you have to generate just to stand still.
How the revenue waterfall connects directly to your retention metrics
The waterfall connects directly to the retention metrics that define a subscription business, because its components are their exact inputs.
Net revenue retention is calculated from beginning ARR plus expansion, minus contraction and churn, divided by beginning ARR, which is the same set of columns the waterfall lays out visually.
That connection makes the waterfall the natural place to diagnose a retention number instead of just reporting it. When your net revenue retention drops, the waterfall shows whether expansion slowed, contraction rose, or churn spiked, so you move from knowing a metric fell to knowing which part caused it.
It also separates the two retention numbers that often get blurred.
Gross revenue retention looks only at the losses and ignores expansion, so reading the negative columns alone gives you gross retention while reading the whole chart gives you net, and seeing both tells you whether expansion is masking a real retention problem.
What healthy and unhealthy waterfall shapes look like once you know how to read one
Once you can read a waterfall, its overall shape tells you the health of the business almost at a glance, and in our experience the shape is what leaders remember long after the numbers fade.
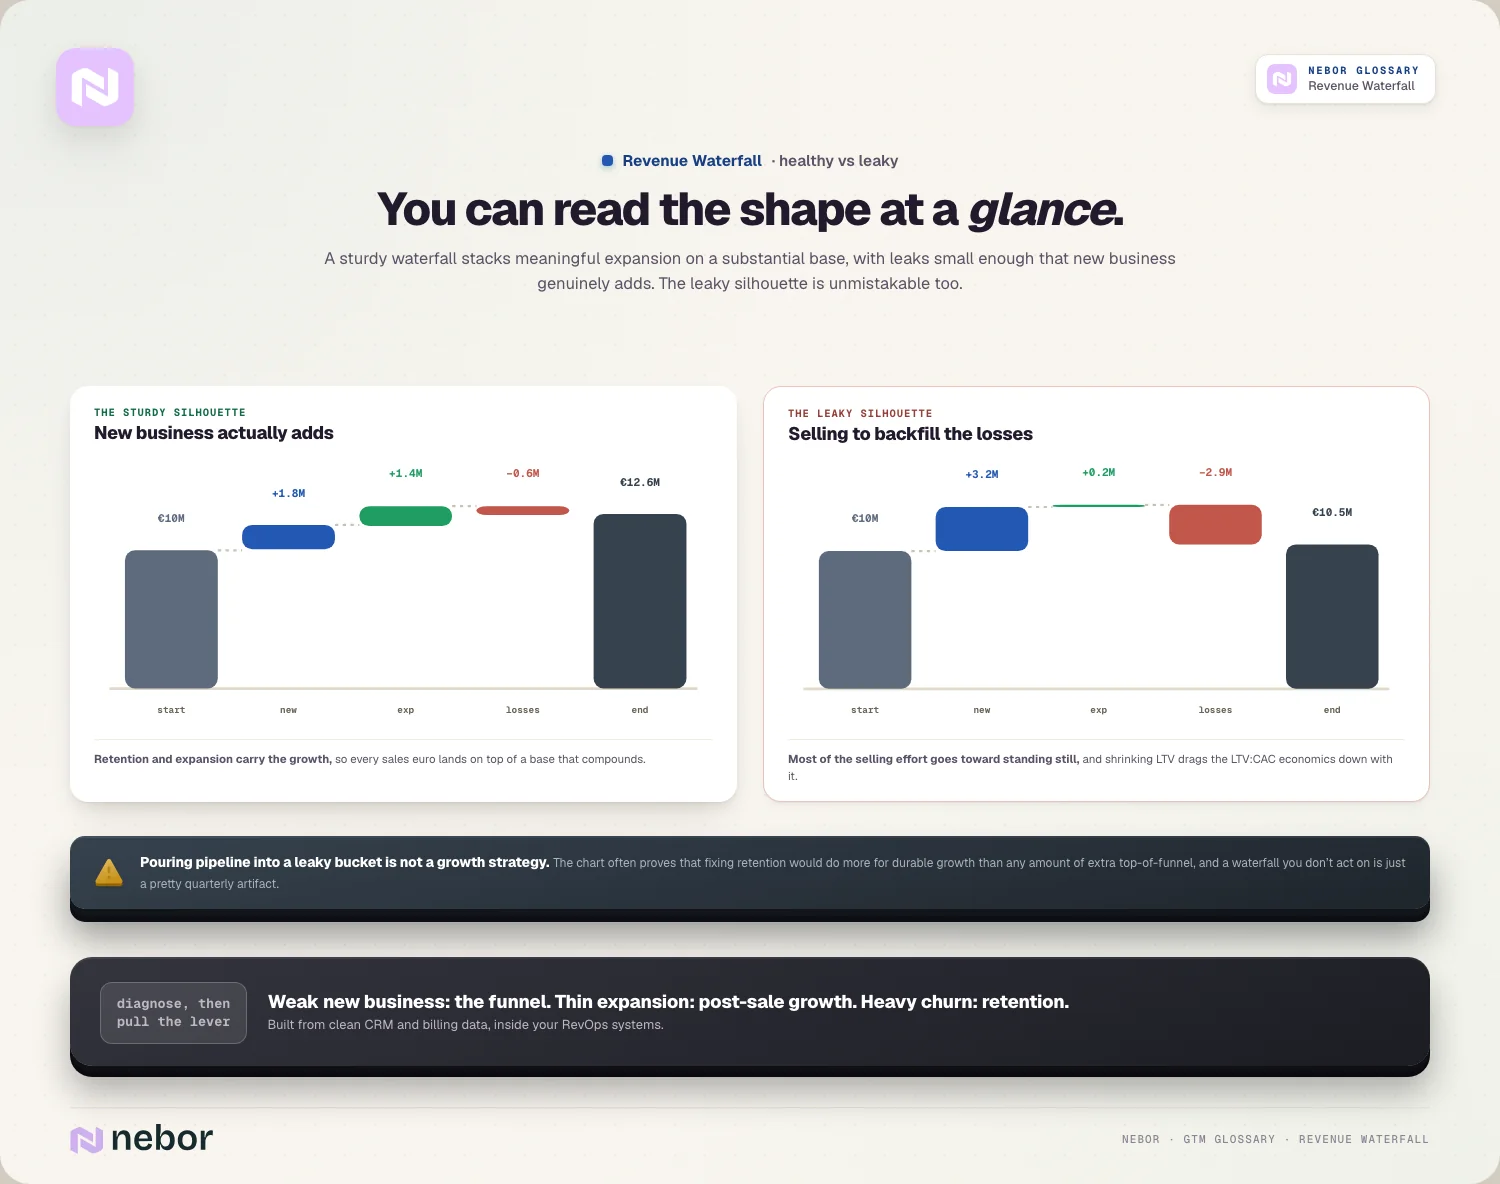
A strong one has a substantial starting base, meaningful expansion stacking on top, and churn and contraction small enough that new business adds to the total instead of backfilling losses.
The benchmarks give you a way to judge the columns instead of eyeballing them.
A net revenue retention above 105% is generally healthy and the best SaaS companies reach 135% or higher, according to Gainsight, while CRV's 2026 benchmarks put median annual revenue churn around 12.5%, with top-quartile companies below roughly 5.5%.
An unhealthy waterfall has a recognizable silhouette too, where churn and contraction are so large that new and expansion revenue is mostly spent replacing what left. A business in that shape can still show net growth, but the waterfall reveals that most of its selling effort is going toward standing still.
Why the revenue waterfall is the honest test of whether growth is efficient
Underneath the components, the waterfall is really measuring how efficient your growth is, meaning how much durable revenue you keep per dollar of effort. A business that retains and expands its base gets compounding returns on customers it already won, whereas one leaning on new logos keeps paying to hold ground.
This efficiency lens connects the waterfall to the unit economics that decide whether growth is worth having. When churn is high, customer lifetime value shrinks because customers don't stay long enough to pay back their cost, so a leaky waterfall and a weak LTV to CAC ratio tend to appear together.
There's a warning here about solving every revenue problem by generating more pipeline. Adding new business on top of a leaky base is like pouring water into a bucket with holes, so the chart often makes the case that fixing retention would do more for durable growth than any amount of extra top-of-funnel volume.
How to build a revenue waterfall from your CRM and billing data
Building a waterfall starts with a clean period and a clean starting number, because everything downstream depends on those anchors.
You pick the window, pull the recurring revenue your accounts carried into it, then classify every change during the period into one of the standard buckets so nothing gets lost or double-counted.
The classification step is where the work really lives, and it's the part we tell clients to budget real time for, because each movement has to be tagged as new, expansion, contraction, or churn based on what happened to that account.
This is far easier when your records are clean, so strong CRM hygiene and accurate billing data are prerequisites instead of nice-to-haves.
Most teams graduate from spreadsheets to dedicated tooling as this gets harder. A one-time waterfall is fine in a spreadsheet, but keeping it accurate every period across a growing base is exactly the repetitive work that belongs inside your revenue operations systems, as guides like Hubifi's walk through.
The common mistakes teams make when they build or read a revenue waterfall
The most frequent mistake is misclassifying the movements, which corrupts the whole chart no matter how good it looks. Counting a returning customer as new business, or logging a downgrade as churn instead of contraction, produces a waterfall that looks precise while telling the wrong story.
Another common error is netting components that should stay separate, usually to make the chart look cleaner. Collapsing expansion and contraction into one column, or hiding gross churn behind a net figure, defeats the entire purpose, because the value is in seeing the opposing forces distinctly.
The subtlest mistake, and one we keep seeing, is reading the chart without acting on it, treating the waterfall as a reporting artifact.
A waterfall showing rising contraction or churn points straight at a problem in onboarding, product, or customer churn drivers, and rebuilding a nice chart every quarter without changing anything wastes the effort.
Why the revenue waterfall is the clearest picture of how your business really grows
The deepest value of a revenue waterfall is that it forces an honest conversation about growth by refusing to let one number stand in for the mechanics beneath it. Once you've seen revenue broken into its real parts, it's hard to celebrate a top-line figure without asking whether the base is compounding or leaking.
That honesty is what makes the waterfall a planning tool instead of a scorecard, because each column suggests a different lever.
Weak new business points at the funnel, thin expansion points at how you grow accounts after the sale, and heavy churn points at retention, which flows through to steadier forecast accuracy too.
Any serious go-to-market system eventually depends on this kind of visibility, because durable growth depends on knowing which flows to protect and which to grow.
When you can read the full waterfall, the new revenue you automate sales prospecting to generate lands on a base you understand instead of disappearing into losses you never named.
Share this post
RevOps
Glossary
Related glossary items
Understanding the core GTM concepts




Ready to build your pipeline