

In this post:
A company can post impressive growth numbers and still be losing money on every customer it wins. Revenue climbs, the charts look great, and underneath it the business is spending more to acquire customers than those customers will ever be worth.
The LTV to CAC ratio is the one number that exposes that. It puts what a customer is worth next to what it cost to win them, and the answer tells you whether your growth is building value or burning cash to fake it.
The LTV to CAC ratio compares customer lifetime value to customer acquisition cost, dividing the two to show how much value each customer generates for every dollar spent winning them. A ratio of three to one means a dollar of acquisition spend returns three dollars of lifetime value.
In plain terms, it answers the question every founder and revenue leader eventually has to face, which is whether you're growing efficiently or just expensively.
TL;DR
The LTV to CAC ratio divides customer lifetime value by acquisition cost, showing how much each customer is worth relative to what you paid to win them.
A three-to-one ratio is the usual floor for healthy B2B SaaS, and the strongest companies push toward four to one or higher across stages.
Read it next to payback period, because a great ratio that takes years to recoup can still strain your cash, while a fast payback keeps growth fundable.
A ratio that climbs too high can signal a problem of its own, because it often means you're underinvesting in growth and leaving demand on the table.
What the LTV to CAC ratio measures when you put it in plain terms
The ratio is a comparison of two numbers you may already track separately. One is the value of a customer, the other is the cost of getting them.
Lifetime value is what a customer is worth to you. The customer lifetime value captures the total margin you expect from an account across the whole relationship.
Acquisition cost is what you spent to win them. The customer acquisition cost sums all your sales and marketing spend divided by the customers it produced.
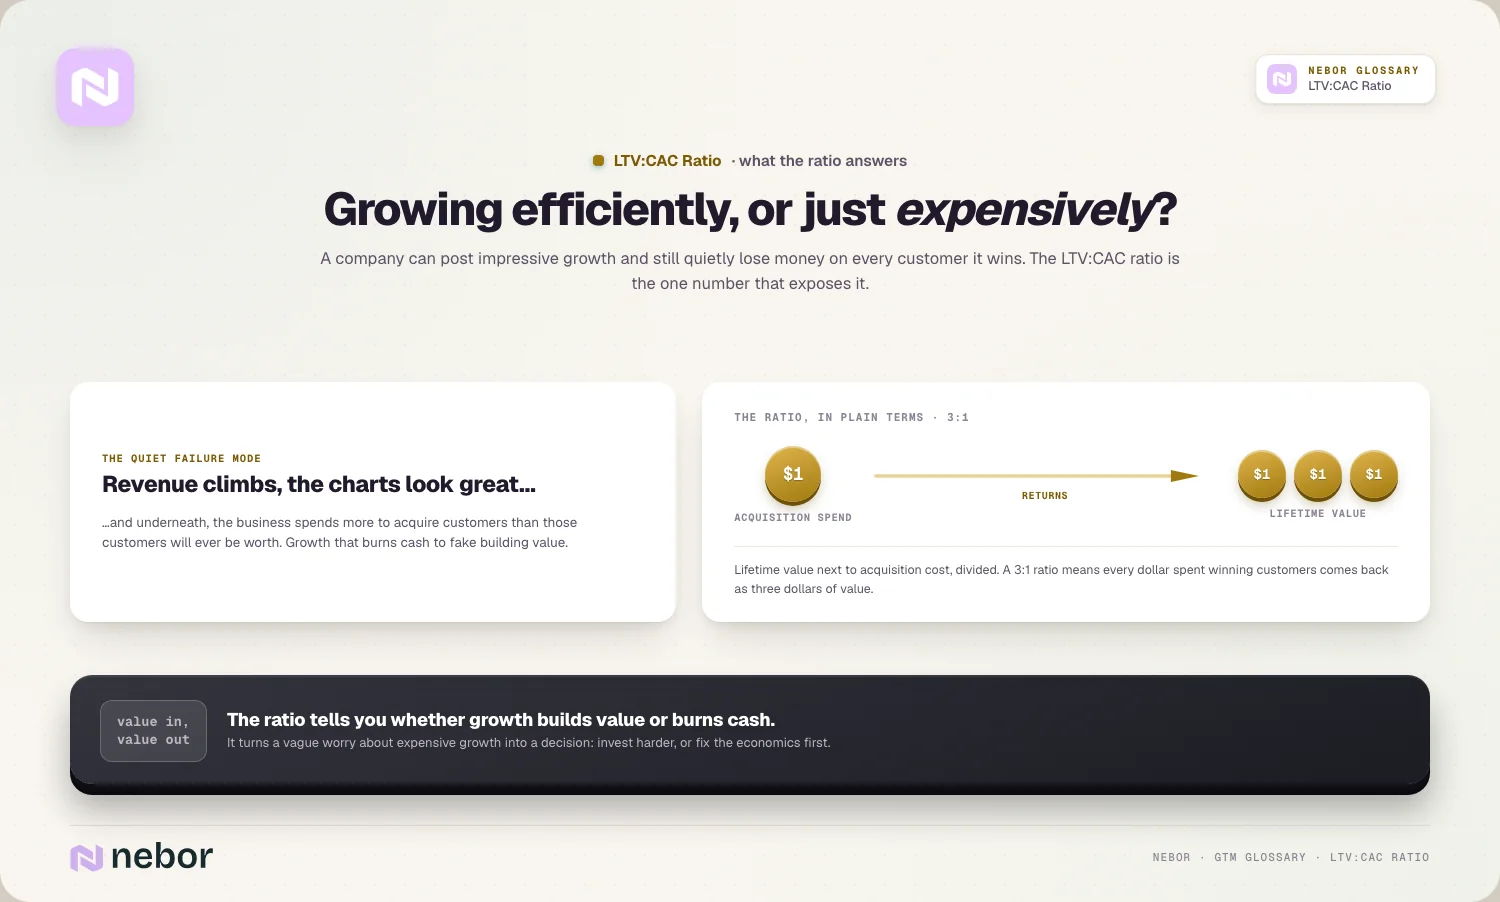
The ratio puts them side by side. Dividing lifetime value by acquisition cost tells you, in a single figure, whether each customer returns more than they cost and by how much.
That single figure is why the ratio carries so much weight. Either number alone can mislead you, but together they reveal whether your growth engine is creating value or destroying it.
It also turns a vague worry into a decision. Instead of sensing that growth feels expensive, you get a number that tells you whether to invest harder or fix the economics first.
How you calculate the LTV to CAC ratio without fooling yourself
The math is simple, and that simplicity is exactly where people go wrong. Sloppy inputs produce a ratio that looks fine while hiding trouble.
Start with a lifetime value you'd defend to a board. A common form is average revenue per account times gross margin, divided by your churn rate, so margin and customer churn rate both shape the result.

Then calculate acquisition cost completely and honestly. Real acquisition cost includes every sales and marketing expense, ad spend, salaries, tools, agencies, and events, well beyond media spend alone.
Finally you divide one by the other. Lifetime value divided by acquisition cost gives the ratio, expressed as something like three to one or four to one.
The discipline lives in the inputs instead of the division. A ratio built on margin-free revenue or a stripped-down cost number flatters you, so honest figures on both sides are what make it trustworthy.
Why a three to one ratio became the benchmark that everyone keeps quoting
The three-to-one figure shows up everywhere, and it stuck for a reason, reflecting a balance between profitability and growth.
A ratio near one to one means you're underwater. When a customer is worth about what you paid to win them, you make no real margin, so growth just burns cash.
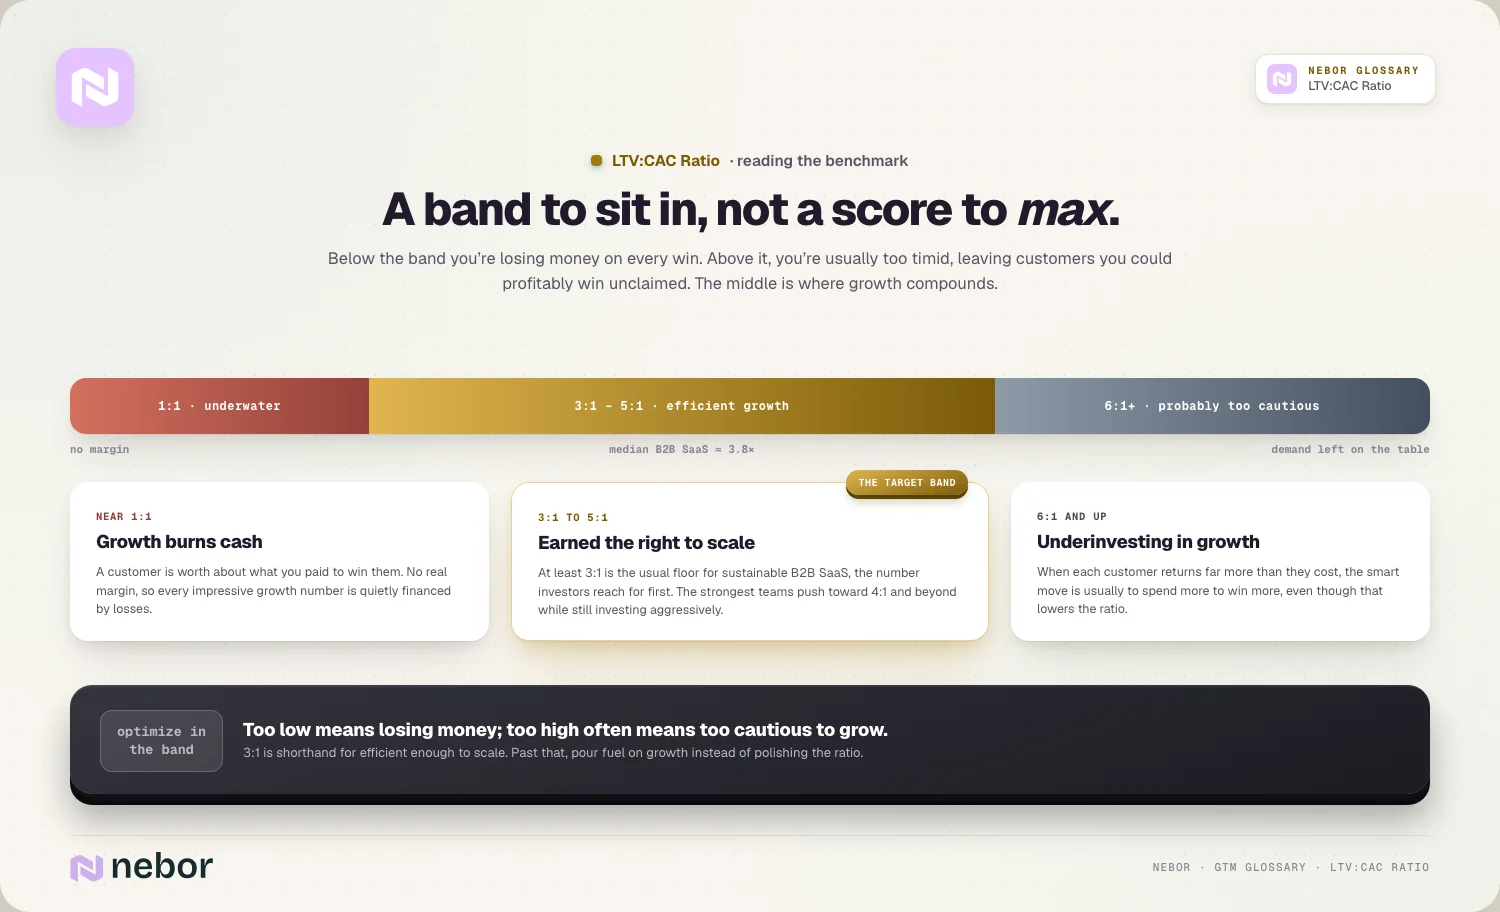
A three-to-one ratio is the usual healthy floor. Most B2B SaaS companies need at least three to one to be sustainably profitable, and that's the reason it's the number investors reach for first.
Elite companies land noticeably higher than that. The strongest teams target four to one or more, and median B2B SaaS is around 3.8 times, which gives you a real sense of the bar.
So three to one is shorthand for efficient enough to scale. Below it, your economics are shaky, and around or above it, you've earned the right to pour fuel on growth.
Why a ratio that looks too good to be true can be a warning sign
Most people assume a higher ratio is always better, and that instinct is wrong past a point. An unusually high ratio often hides a missed opportunity.
A very high ratio can mean underinvestment. If your ratio is six or eight to one, you may be spending too little on acquisition and leaving customers you could profitably win unclaimed.
Growth has a cost that deserves paying. When each customer returns far more than they cost, the smart move is often to spend more to win more, even though that lowers the ratio.
The goal is efficient growth instead of a maxed-out ratio. A three-to-one to five-to-one range usually reflects a company investing aggressively while staying healthy, which is better than a sky-high ratio with timid spend.
So the ratio is something to optimize within a band instead of pushing endlessly upward. Too low means you're losing money, and too high often means you're being too cautious to grow.
Why your payback period matters just as much as the ratio itself does
The LTV to CAC ratio has a blind spot, and payback period fills it. The ratio tells you if a customer pays off, while payback tells you how fast.
The ratio ignores the timing of the money completely. A four-to-one ratio looks great, but if it takes three years to recoup the acquisition cost, your cash is tied up for a long, risky stretch.
Payback period measures exactly that waiting time. It's the months it takes a customer's margin to repay what you spent winning them, which is what your cash flow feels day to day.
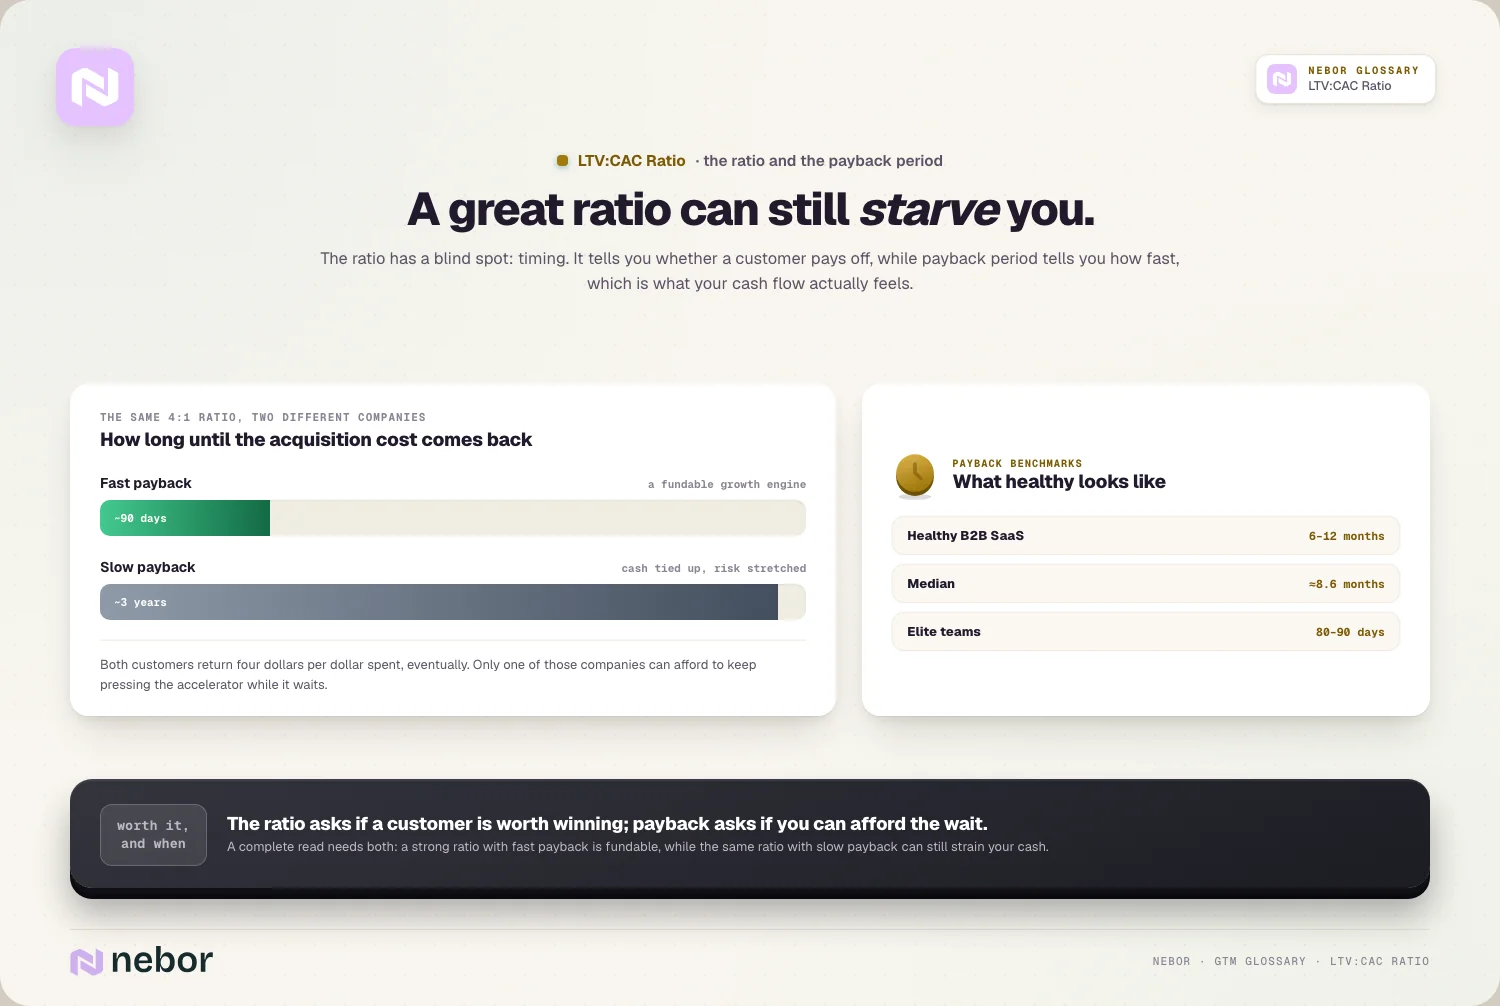
The benchmarks on this one are usefully concrete. Healthy B2B SaaS recoups acquisition cost in 6 to 12 months, with elite teams hitting 80 to 90 days, and the median is near 8.6 months.
So you read the ratio and payback together. A strong ratio with a fast payback is a fundable growth engine, while a strong ratio with slow payback can still starve you of cash.
The two metrics answer two different worries. The ratio asks whether a customer is worth winning at all, and payback asks whether you can afford to wait for the return, so a complete read needs both.
How the LTV to CAC ratio you should expect changes as your company grows
The ratio you should expect depends heavily on your stage. A number that's fine early would be weak at scale.
Early-stage companies live with leaner ratios by necessity. Below a couple of million in revenue, a ratio around 2.5 to one with a longer payback is common and acceptable, because you're still finding efficient channels.
Growth-stage companies should tighten up quite a bit. Between roughly two and ten million in revenue, the target moves to 3 to 4 to one, with payback near 90 days as your motion matures.
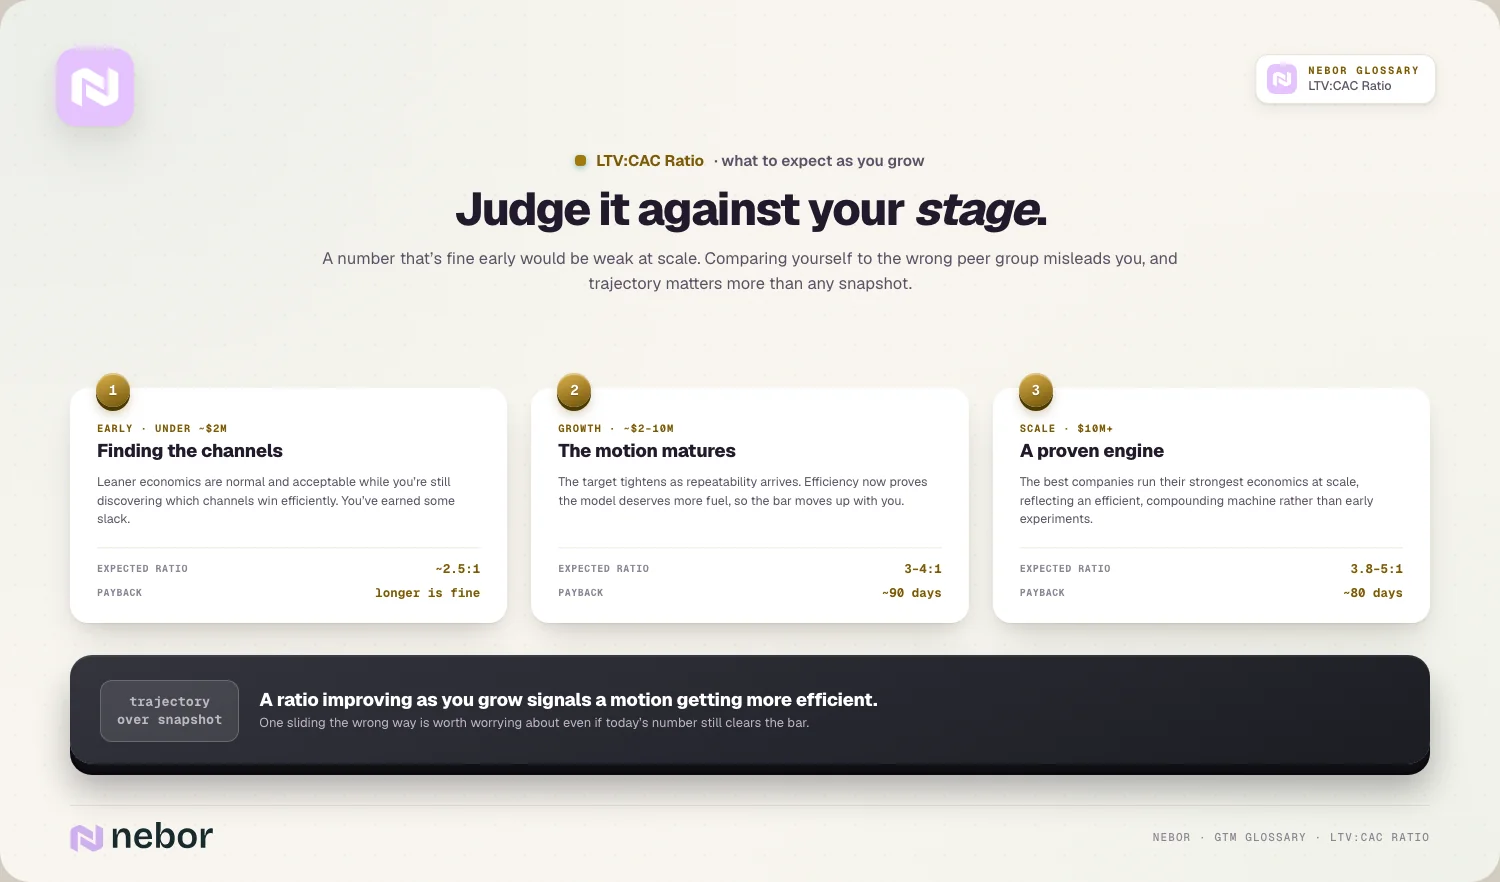
Scale-stage companies show the strongest economics of all. Past ten million, the best companies reach 3.8 to 5 to one, with payback around 80 days, reflecting a proven, efficient engine.
So judge your ratio against your stage instead of a single universal number. An early company earns slack that a scaled one does not, and comparing yourself to the wrong peer group misleads you.
Trajectory matters more than any single snapshot. A ratio improving as you grow signals a motion that's getting more efficient, while one sliding the wrong way deserves attention even if the current number still clears the bar.
How you improve a weak LTV to CAC ratio without just cutting spend
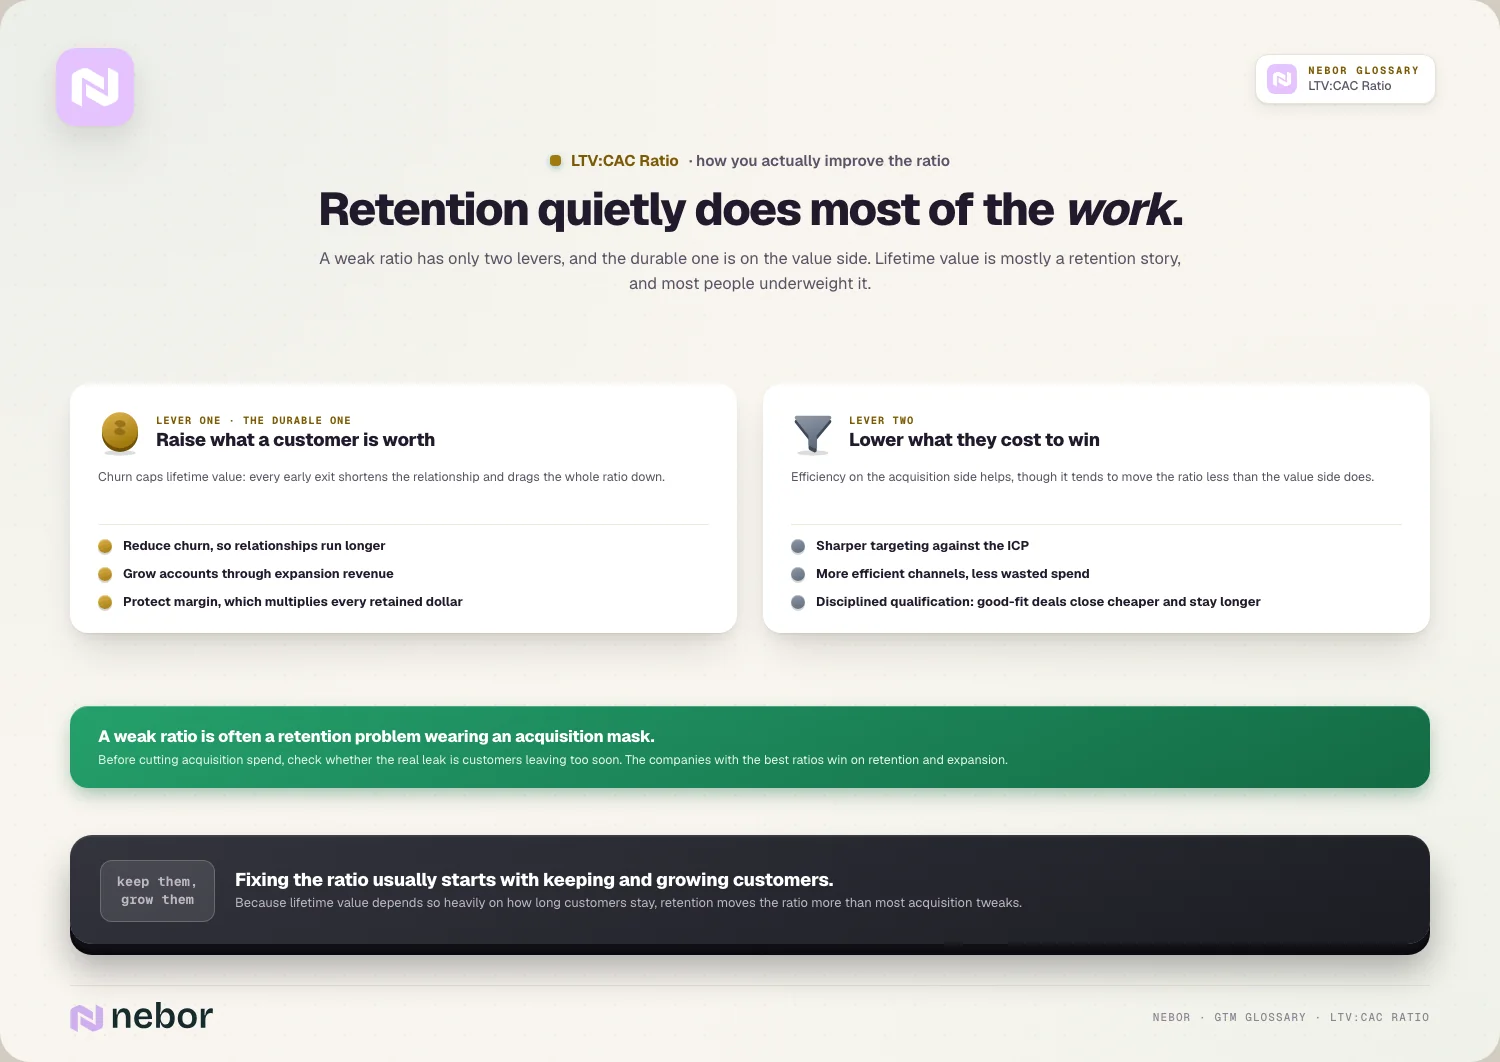
A low ratio has only two levers, and both deserve pulling. You either raise what a customer is worth or lower what they cost to win.
Lifting lifetime value is the durable lever. Reducing churn, growing accounts through expansion revenue, and improving margin all raise the top of the ratio without spending more on acquisition.
Lowering acquisition cost is the other lever. Sharper targeting of your list against your ideal customer profile and more efficient channels reduce what you pay per customer.
Fit also protects both sides at once. When your team wins customers who match your profile well, through disciplined lead qualification, they cost less to close and tend to stay longer, which lifts the ratio from both ends.
Retention is often the biggest win of the lot. Because lifetime value depends so heavily on how long customers stay, protecting it through strong net revenue retention moves the ratio more than most acquisition tweaks.
So fixing the ratio usually starts with keeping and growing customers before acquiring them cheaper. The companies with the best ratios tend to win on retention and expansion, where the durable value lives.
Why retention does most of the quiet work behind your LTV to CAC ratio
Of the two numbers in the ratio, lifetime value is the one most people underweight, and in our experience lifetime value is mostly a retention story.
Churn puts a hard cap on lifetime value. Because lifetime value depends on how long a customer stays, a high churn rate shortens every relationship and drags the whole ratio down.
Retained revenue compounds year after year after year. Customers who stay and grow keep adding value, so strong gross revenue retention lifts lifetime value far beyond what the first sale suggests.
This reframes the ratio as a full-funnel metric. Acquisition efficiency is only half of it, with the other half being whether the customers you acquire stick around long enough to pay off.
So a weak ratio is often a retention problem wearing an acquisition mask. Before cutting acquisition spend, check whether the real leak is customers leaving too soon.
How the LTV to CAC ratio fits into the bigger picture of efficient growth
The ratio connects to how the whole revenue machine performs, as one readout among several that describe efficiency.
It reflects the health of your whole engine. A strong ratio signals a revenue engine that converts spend into durable value rather than leaking it.
It pairs with pipeline velocity as well. A healthy ratio alongside strong pipeline velocity shows you're winning efficient customers quickly, which is the combination that compounds.
It guides where the money should go. The ratio tells you whether to spend more on growth or fix economics first, so it shapes the biggest decisions about where money goes.
So the ratio works as a strategic compass on top of a finance metric. It tells you whether your growth deserves accelerating, which is one of the most important things a leadership team can know.
Why investors lean on the LTV to CAC ratio so heavily when they evaluate you
If you ever raise money or sell, this ratio moves to the center of the conversation. Investors treat it as a quick read on whether your growth is real.
It signals efficient growth at a glance. A healthy ratio tells a buyer you turn acquisition spend into durable value, which is the difference between a business that scales and one that just spends.
It's hard to dress up on short notice. Because it combines cost and retained value, the ratio is tougher to dress up than a single growth number, so investors trust it as a sanity check.
It shapes how much they'll fund you. A company with strong economics can raise on the promise that more capital produces more profitable customers, while weak economics make new money look like it will simply burn.
So the ratio is as much a fundraising metric as an operating one. A strong, honest figure tells investors your growth deserves more capital, which is often what a raise comes down to.
The common ways teams get the LTV to CAC ratio wrong without realizing it
The ratio is easy to calculate and easy to misuse, and we keep seeing the same recurring errors make it lie to the people relying on it.
The biggest is using revenue instead of margin in lifetime value. When you skip gross margin, lifetime value inflates and the ratio looks far healthier than the business really is.
Another is understating the cost side of the equation. Leaving out salaries, tools, or overhead shrinks the cost side, so the ratio flatters a motion that's genuinely expensive.
A third is ignoring the payback entirely. A team can celebrate a four-to-one ratio while a multi-year payback drains the cash the business needs to operate.
The last is chasing the ratio too high. Treating a bigger number as automatically better leads teams to underspend on growth they could profitably afford.
A subtler error is reading the ratio once a year, and we tell clients to check it quarterly. Economics drift as channels saturate and churn shifts, so a number you check only at planning time can hide a problem that's been building for months.
Reading the LTV to CAC ratio as a verdict on the growth you're chasing
The whole point of the ratio is to answer whether your growth is creating value or consuming it. A dollar in should reliably return several dollars over the life of the customer, and this number tells you whether it does.
A ratio around three to one with a payback under a year points to an engine worth feeding. Anything below that suggests you should fix the economics before scaling, because spending more on broken unit economics only multiplies the loss.
What surprises most teams is how little of this comes down to cheaper acquisition. The companies with the strongest ratios tend to win on retention and expansion, where customers stay long enough and grow large enough to pay everything back many times over.
That's why the ratio works so well as the financial conscience of a modern go-to-market system. It keeps you honest about whether the growth you're proud of is actually paying for itself, even while you automate sales prospecting to win customers faster.
Share this post
RevOps
Glossary
Related glossary items
Understanding the core GTM concepts




Ready to build your pipeline