

In this post:
Every pitch deck has that one slide. A giant number, usually in the billions, with a confident claim that this is the market the company is going after. Most of the time, that number is close to meaningless.
The problem is that a huge total market tells you almost nothing about what you can win. Real market sizing takes three nested numbers instead of one impressive figure, each getting progressively more honest about your real opportunity.
TAM, SAM, and SOM are three layers of market sizing. TAM is the total addressable market, SAM is the serviceable addressable market, and SOM is the serviceable obtainable market, each a smaller, more realistic slice of the one before it.
The point of using all three is honesty. TAM shows the ceiling, SAM shows the part you could realistically serve, and SOM shows what you can plausibly capture, which is the number that should drive your real plans.
TL;DR
TAM, SAM, and SOM are three nested measures of market size. TAM is the whole market, SAM is the portion your product and reach can serve, and SOM is the share you can realistically win.
A single big market number is misleading on its own, and breaking it into three layers forces an honest view of your real opportunity instead of the theoretical maximum.
You calculate them by starting from the total market and narrowing it with filters for what you serve and what you can realistically capture, using either top-down or bottom-up methods.
One caution belongs alongside them, because these numbers are estimates instead of facts. Their value is in the thinking they force and the targeting they inform, so an inflated TAM that ignores SAM and SOM does more harm than good.
So what do TAM, SAM, and SOM each mean, layer by nested layer?
The three terms describe the same market at three levels of realism. Each narrows the one above it to get closer to what you can truly reach.
TAM, the total addressable market, is the entire revenue opportunity if you had 100% of the market with no competition. It's the absolute ceiling, useful as context and dangerous as a target.
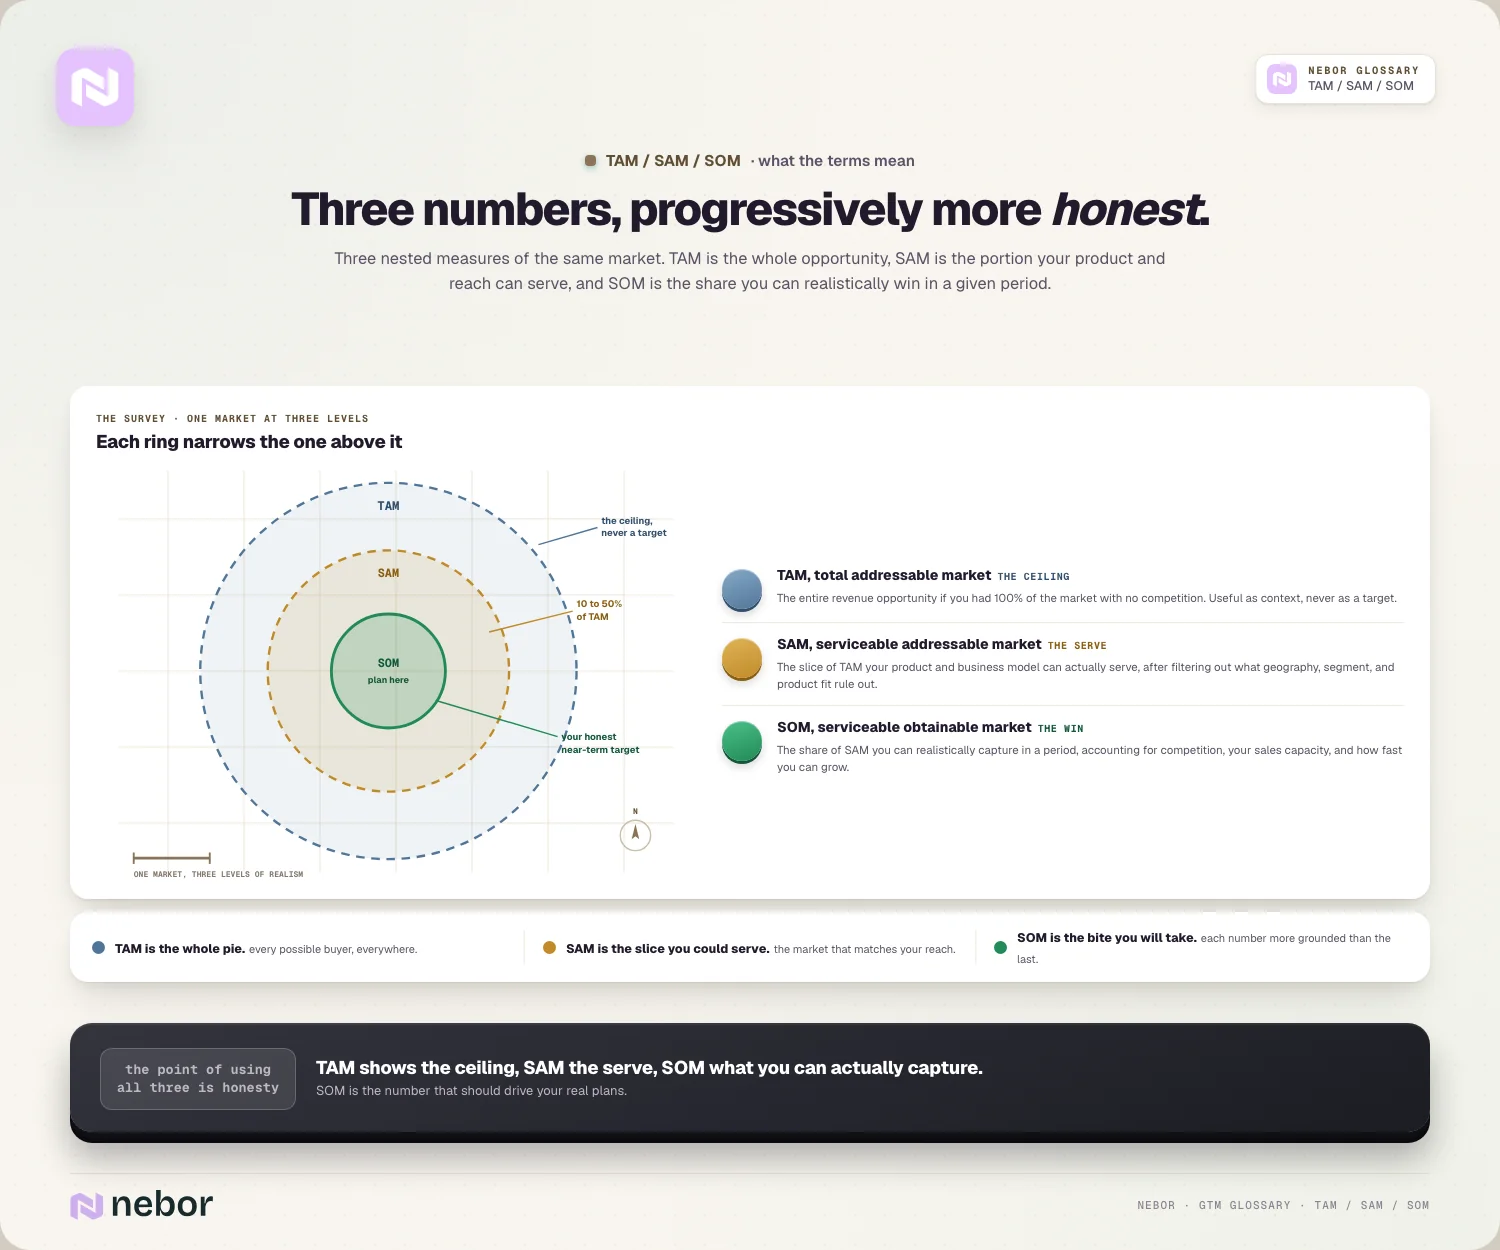
SAM, the serviceable addressable market, is the slice of TAM your product and business model can truly serve. It filters out the parts you can't reach because of geography, segment, or product fit.
SOM, the serviceable obtainable market, is the share of SAM you can realistically capture in a given period. It accounts for competition, your sales capacity, and how fast you can realistically grow.
So they nest like rings inside each other. TAM is the whole pie, SAM is the slice you could serve, and SOM is the bite you'll actually take, with each number more grounded than the last.
Why is a single market number so misleading when it stands alone?
The way TAM alone fools people deserves a closer look, because the mistake is everywhere, and a big total market creates a false sense of opportunity.
A huge TAM ignores reality on several fronts. It assumes you can serve everyone, beat every competitor, and reach every buyer, none of which is ever true for a real business.
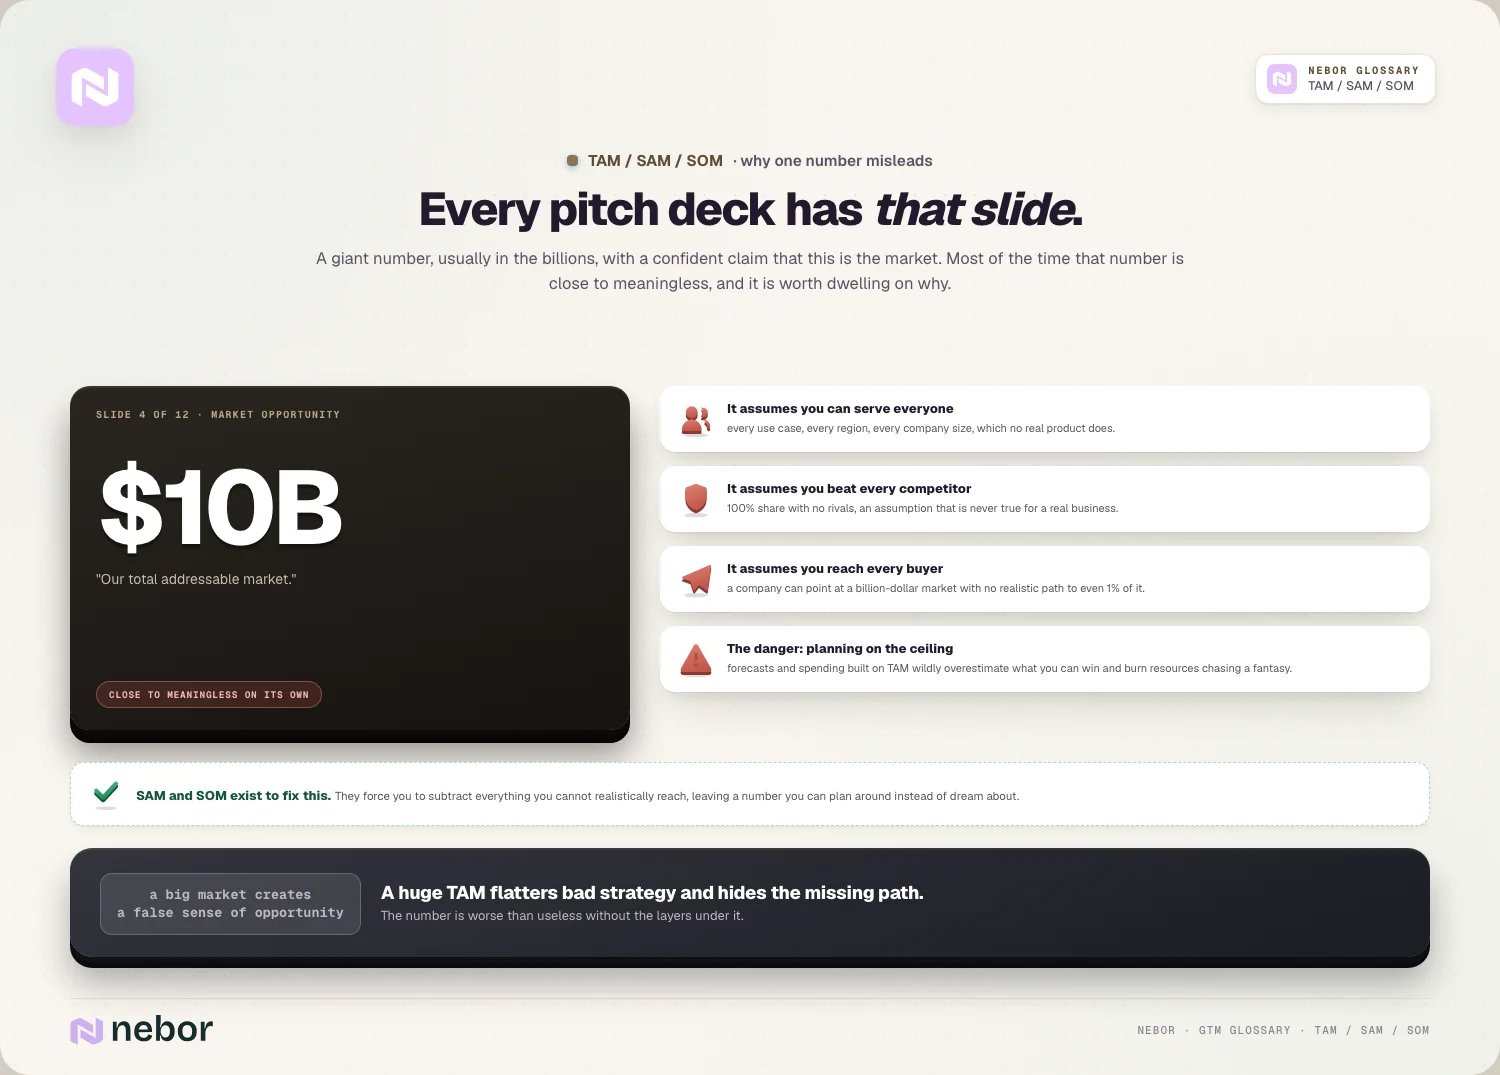
It flatters bad strategy just as easily. A company can point at a billion-dollar market while having no realistic path to even 1% of it, which makes the number worse than useless.
The danger is planning on the ceiling. If you build your forecasts and spending around TAM, you'll wildly overestimate what you can win and burn resources chasing a fantasy.
SAM and SOM exist to fix this. They force you to subtract everything you can't realistically reach, leaving a number you can plan around instead of dream about.
How do you calculate TAM without inheriting someone else's guess?
TAM is the starting point, and there are two main ways to size it. The method you choose shapes how trustworthy the number is.
The simplest formula multiplies your potential customers by the average revenue per customer. If a million companies could buy your product at an average of ten thousand a year, your TAM is ten billion.
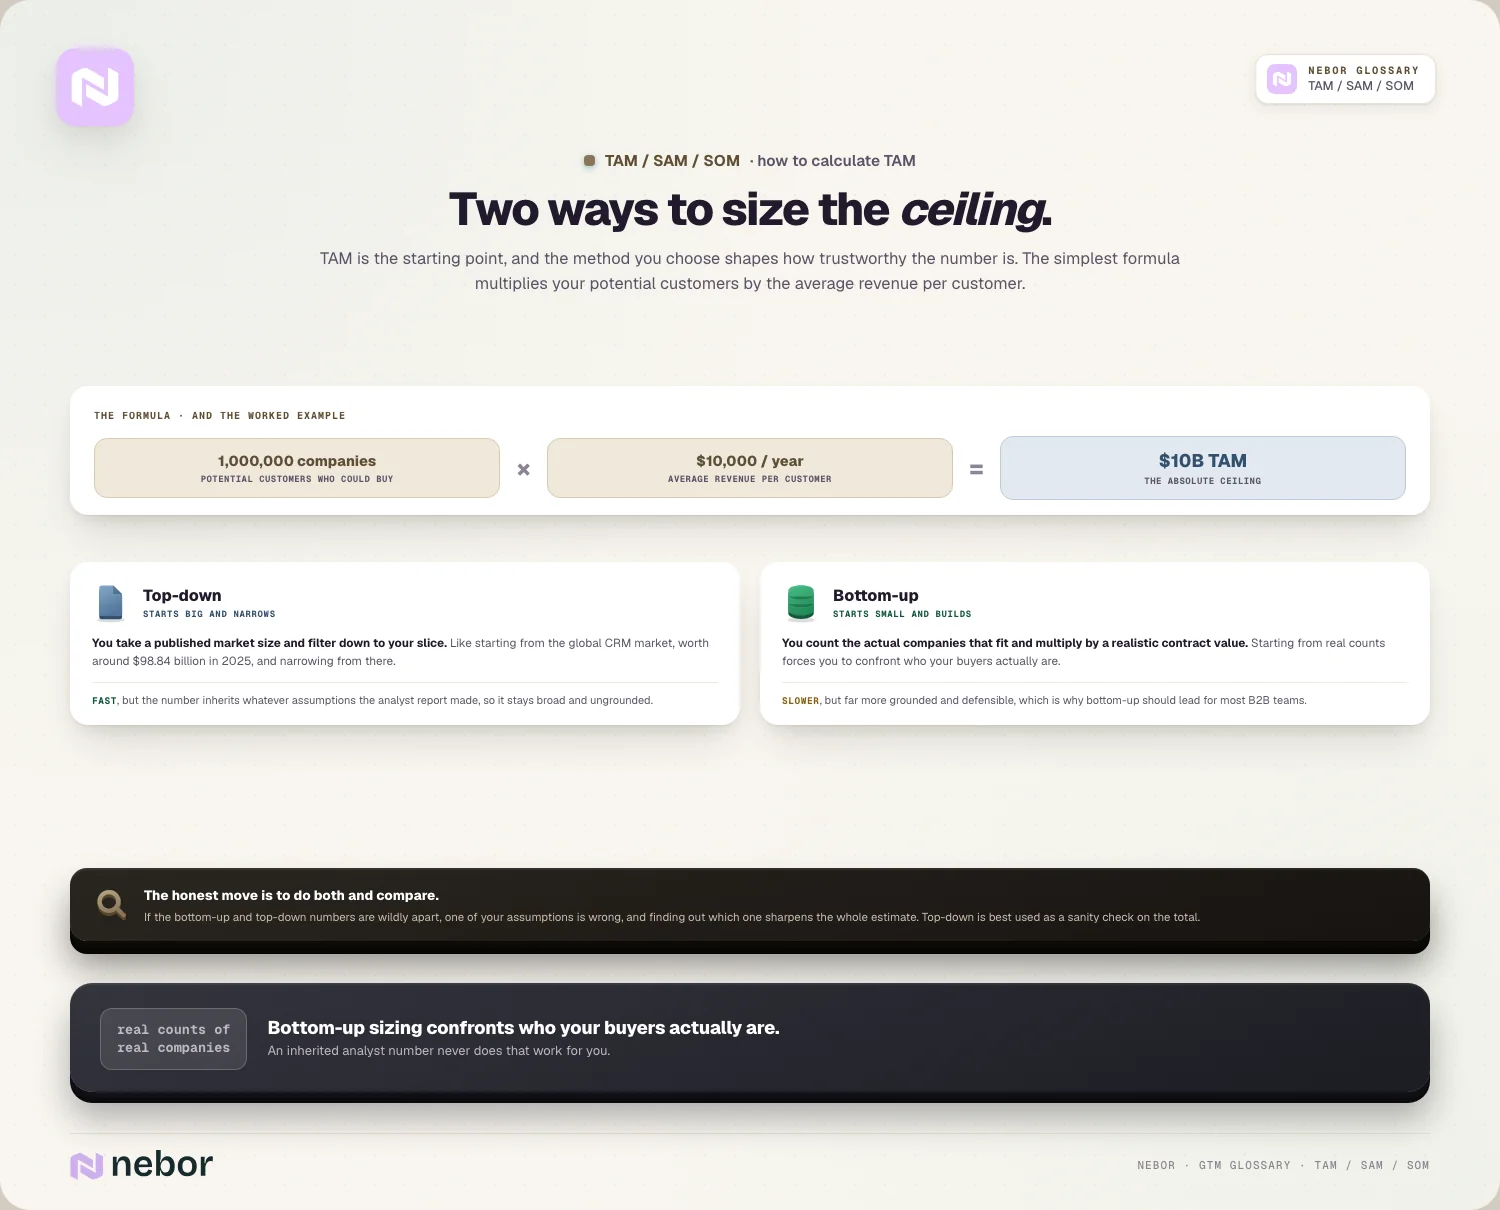
The top-down approach starts from industry reports. You take a published market size, like the global CRM market worth around $98.84 billion in 2025, and narrow from there.
The bottom-up approach builds from your own data. You count the actual companies that fit and multiply by a realistic contract value, which tends to produce a more grounded, defensible number.
For most teams, bottom-up is more honest. Starting from real counts of real companies forces you to confront who your buyers really are, instead of inheriting an analyst's broad number.
How do you narrow TAM down to the SAM your business can serve?
Once you have TAM, SAM is about subtracting what you can't serve. You apply filters that reflect the real limits of your business.
Product fit is the first filter to apply. You remove the parts of the market your product doesn't serve, because a broad category usually includes use cases you don't address.
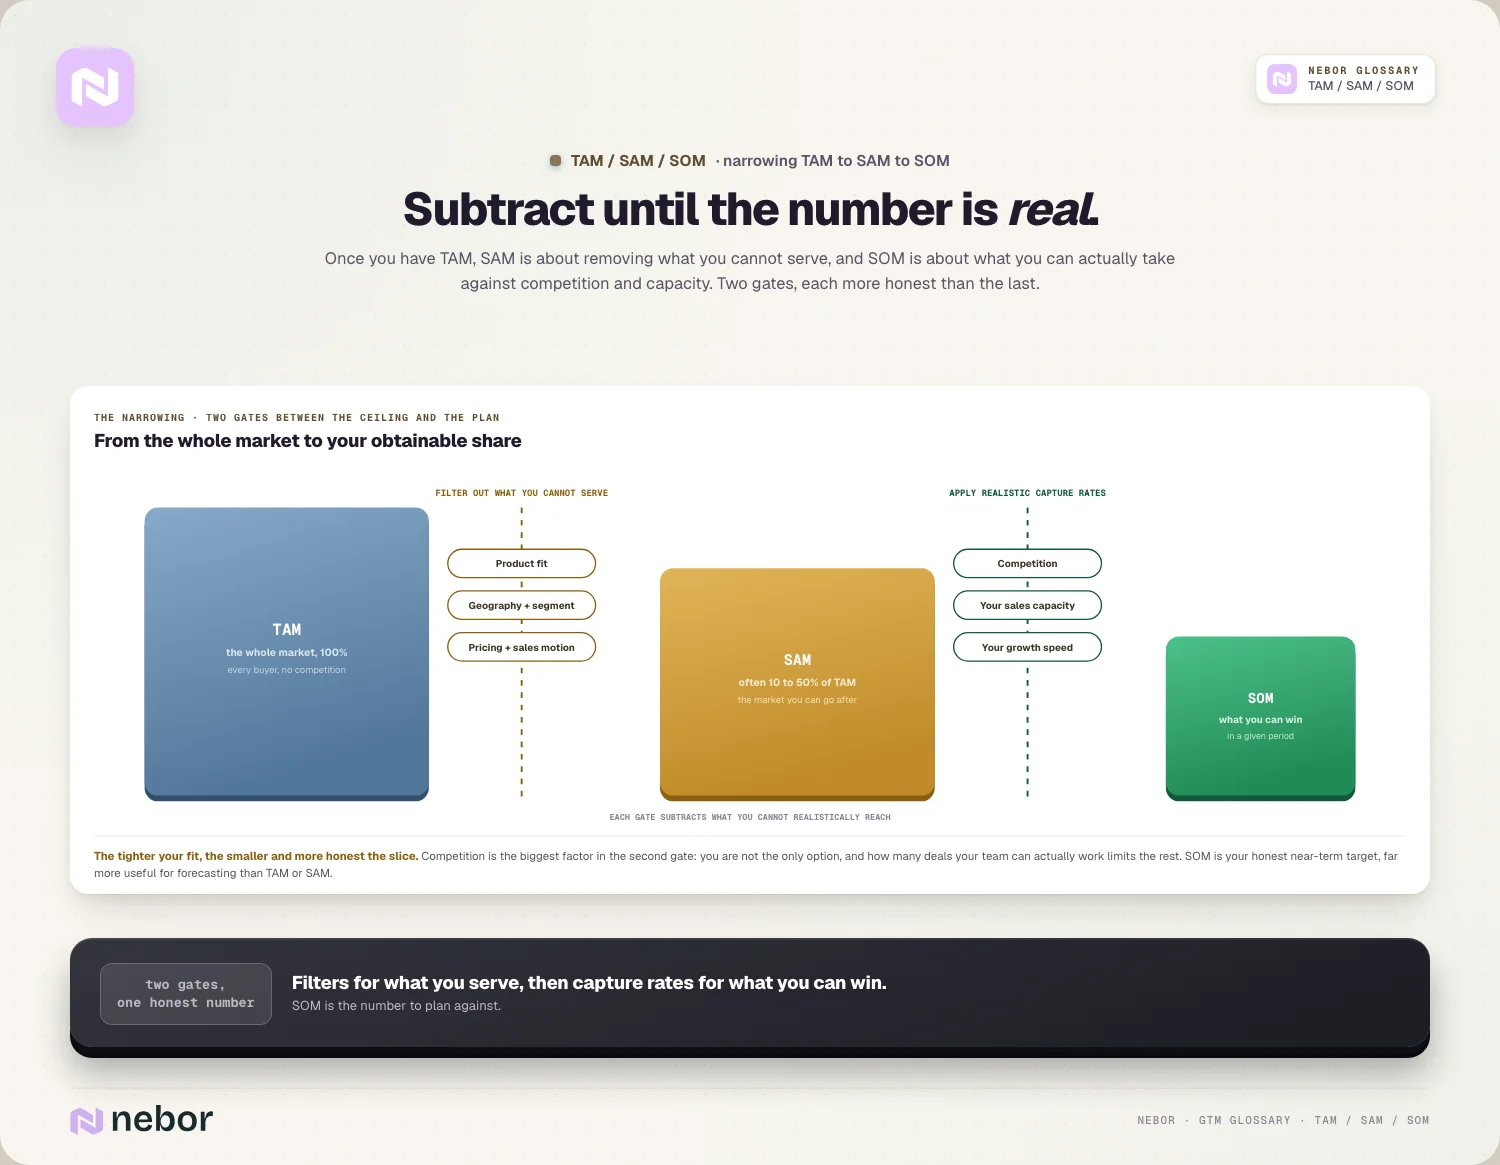
Geography and segment usually cut even deeper. If you only sell in certain regions or to certain company sizes, you cut everyone else out, which often shrinks the number a lot.
And your business model trims the rest, because your pricing, distribution, and sales motion all limit who you can realistically reach, so SAM reflects the market you can properly go after.
As a rough guide, SAM often lands at around 10 to 50% of TAM, depending on how broad or narrow your focus is. The tighter your fit, the smaller and more honest the slice.
How do you get from SAM to the SOM you can honestly capture?
SOM is the most realistic and most useful number, because it reflects what you can win in practice. Getting there means accounting for the real world.
You start from SAM and apply realistic capture rates. Given your competition, your sales capacity, and your growth speed, what share of the serviceable market can you take in a given period?
Competition is the biggest factor to subtract. You're never the only option, so SOM reflects the portion you can win against rivals instead of the whole serviceable market.
Your own capacity matters just as much. How many deals your team can work and close limits how much of SAM you can realistically capture, no matter how big it is.
So SOM is the number to plan against. It's your honest near-term target, the market you can genuinely obtain, which is far more useful for forecasting than TAM or SAM.
How does market sizing connect to your ideal customer profile?
Market sizing and your customer profile depend on each other completely. You can't size a market well without knowing exactly who you serve, and we tell clients to fix the profile before the spreadsheet.
Your ideal customer profile defines the companies worth pursuing, and SAM is essentially the market that matches it. A sharp ICP makes your SAM precise instead of vague.
This is where bottom-up sizing and ICP meet. Counting the real companies that fit your profile, using firmographic data, gives you both a grounded SAM and a target list at the same time.
It feeds prioritization inside the market as well. An ICP scoring model helps you rank within your SAM, so you focus on the best-fit accounts inside the market you can serve.
So good market sizing is far from an abstract finance exercise. When you check it against your ICP, it directly shapes who you target, which is where the numbers turn into action.
How does market sizing turn into a go-to-market plan you can act on?
The point of sizing a market is to act on it, so it has to connect to execution. The numbers should shape your whole motion.
It anchors your go-to-market strategy before anything else. Knowing your SAM and SOM tells you which segments to focus on and how aggressive your growth plans can realistically be.
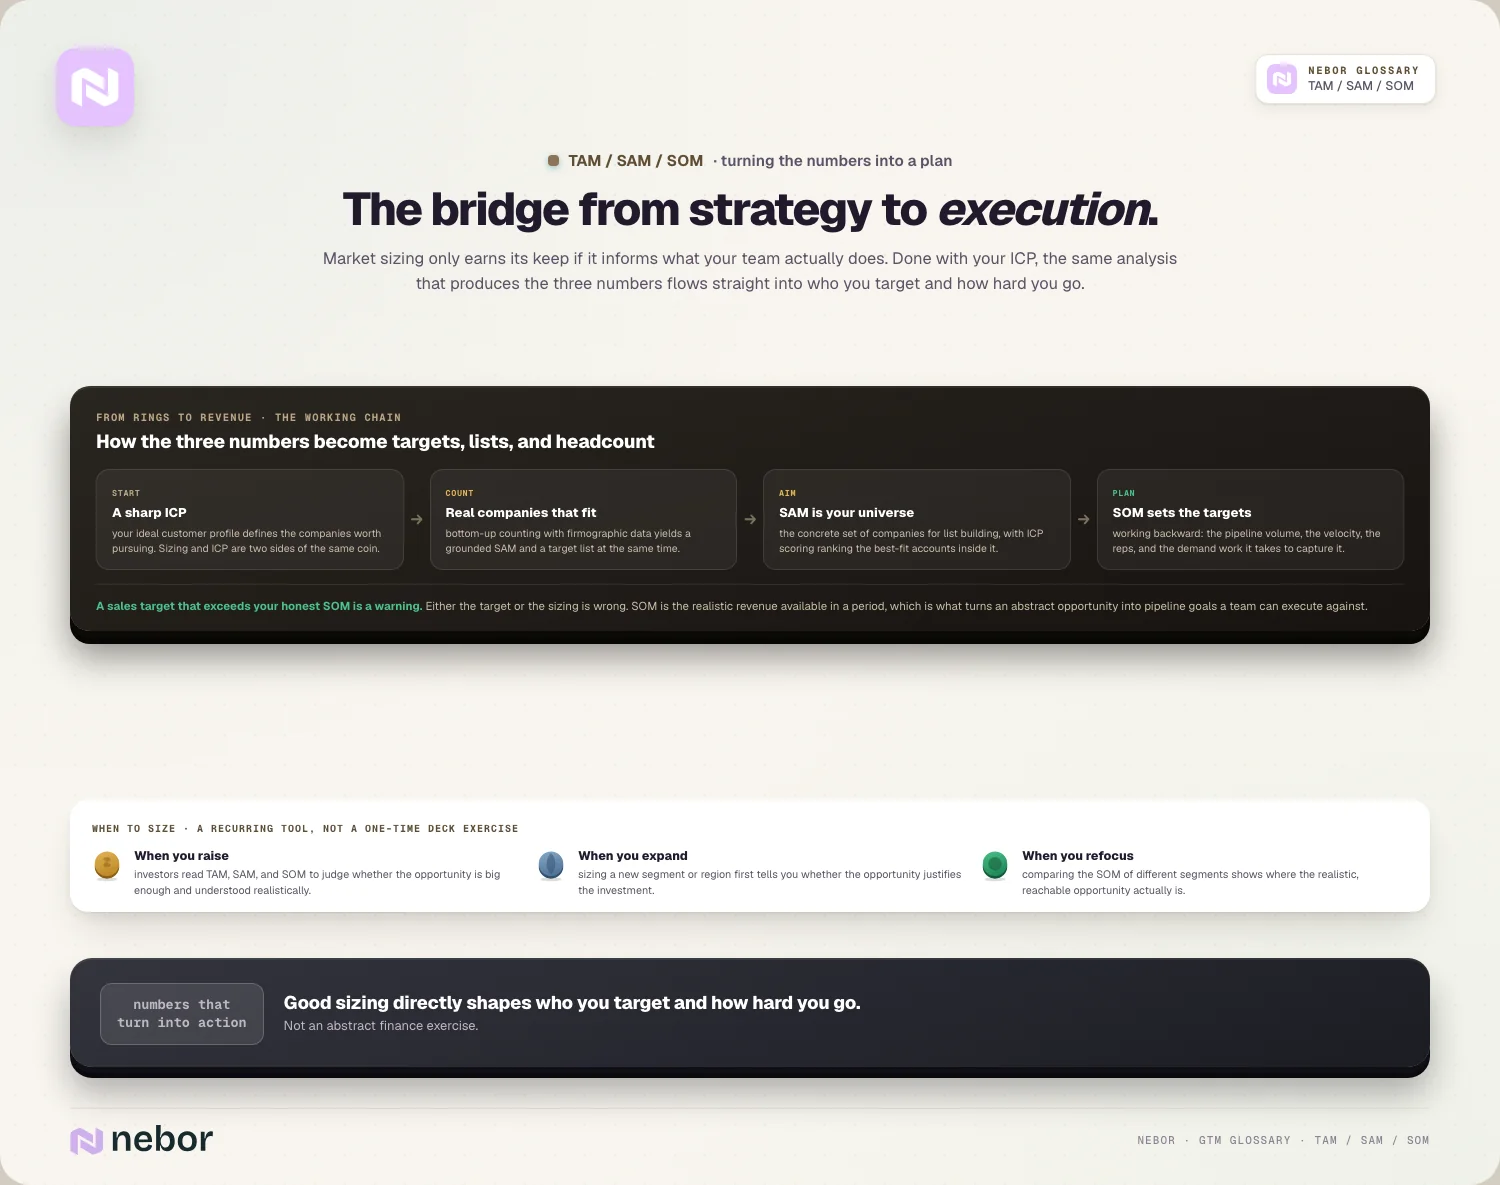
It informs your targeting just as directly. Your SAM is essentially the universe for your list building, turning an abstract market size into the concrete set of companies you'll really reach.
It sizes your demand work on top of that. Understanding the market tells you how much demand generation and outbound sales effort it takes to capture your SOM.
So market sizing is the bridge from strategy to execution. The same analysis that produces TAM, SAM, and SOM should flow straight into who you target and how hard you go after them.
When should you size your market, and how often should you redo it?
Market sizing earns its use at several points instead of once for a deck. Knowing when to do it keeps it practical.
The obvious moment is a fundraising round. Investors want to see TAM, SAM, and SOM to judge whether the opportunity is big enough and whether you understand it realistically.
It's just as useful for expansion planning. Sizing a new segment or region before you commit tells you whether the opportunity justifies the investment, which prevents expensive guesses.
It guides focus too, because when you're deciding where to point your team, comparing the SOM of different segments shows you where the realistic, reachable opportunity is.
So sizing works best as a recurring tool. You revisit it whenever you're raising, expanding, or reprioritizing, because the market and your position in it keep changing.
Should you size your market top-down or bottom-up, or do both?
The two main approaches to sizing produce very different levels of confidence, and in our experience the strongest analyses use both.
Top-down starts big and narrows from there. You take a published industry figure and apply filters to estimate your slice, which is fast but inherits whatever assumptions the report made.
Bottom-up starts small and builds up from reality. You count the actual companies that fit your profile and multiply by a realistic contract value, which is slower but far more grounded in reality.
The honest move is to do both and compare. If your bottom-up number and your top-down number are wildly apart, one of your assumptions is wrong, and finding out which sharpens the whole estimate.
For most B2B teams, bottom-up should lead. It forces you to confront real buying intent and real companies, while top-down is best used as a sanity check on the total you arrive at.
How do TAM, SAM, and SOM connect to the sales targets you set?
Market sizing only proves its value when it informs what your team is trying to hit. The link between SOM and your targets should be direct.
Your SOM is essentially the realistic revenue available to you in a period. A sales target that exceeds your honest SOM is a sign that either the target or the sizing is wrong.
It also tells you how much pipeline you need. Working backward from SOM, you can estimate the volume of opportunities and the pipeline velocity required to capture that share.
It even sizes your team for you. If your SOM demands a certain number of deals, you can reason about how many reps and how much demand it takes to get there.
So SOM is the link between the market and the plan. It turns an abstract opportunity into concrete targets, headcount, and pipeline goals your team can execute against.
What are the common mistakes people make with TAM, SAM, and SOM?
Market sizing goes wrong in a few predictable ways, and we keep seeing them in the decks and plans clients share with us. Most come from chasing big numbers instead of honest ones.
Inflating TAM is the most common by far, because quoting a giant total market to look impressive, with no realistic path to it, fools investors and yourself at the same time.
Skipping SAM and SOM follows right behind, because TAM alone is meaningless without the layers that narrow it, so a single number tells you nothing about your real opportunity.
Going only top-down weakens the whole estimate, because relying solely on analyst reports produces broad, ungrounded numbers, when bottom-up sizing from real companies is far more defensible.
And treating estimates as facts misleads everyone downstream, because these numbers are educated guesses, so presenting them with false precision, or never revisiting them, does quiet damage.
Can a market be too small, or is a bigger number always the better one?
A common worry is whether a modest TAM is a dealbreaker. The answer is more nuanced than bigger is always better, and it depends on your goals.
A small market can be perfectly viable. A focused product serving a narrow, high-value segment can build a strong business, even if the total market would never excite a venture investor.
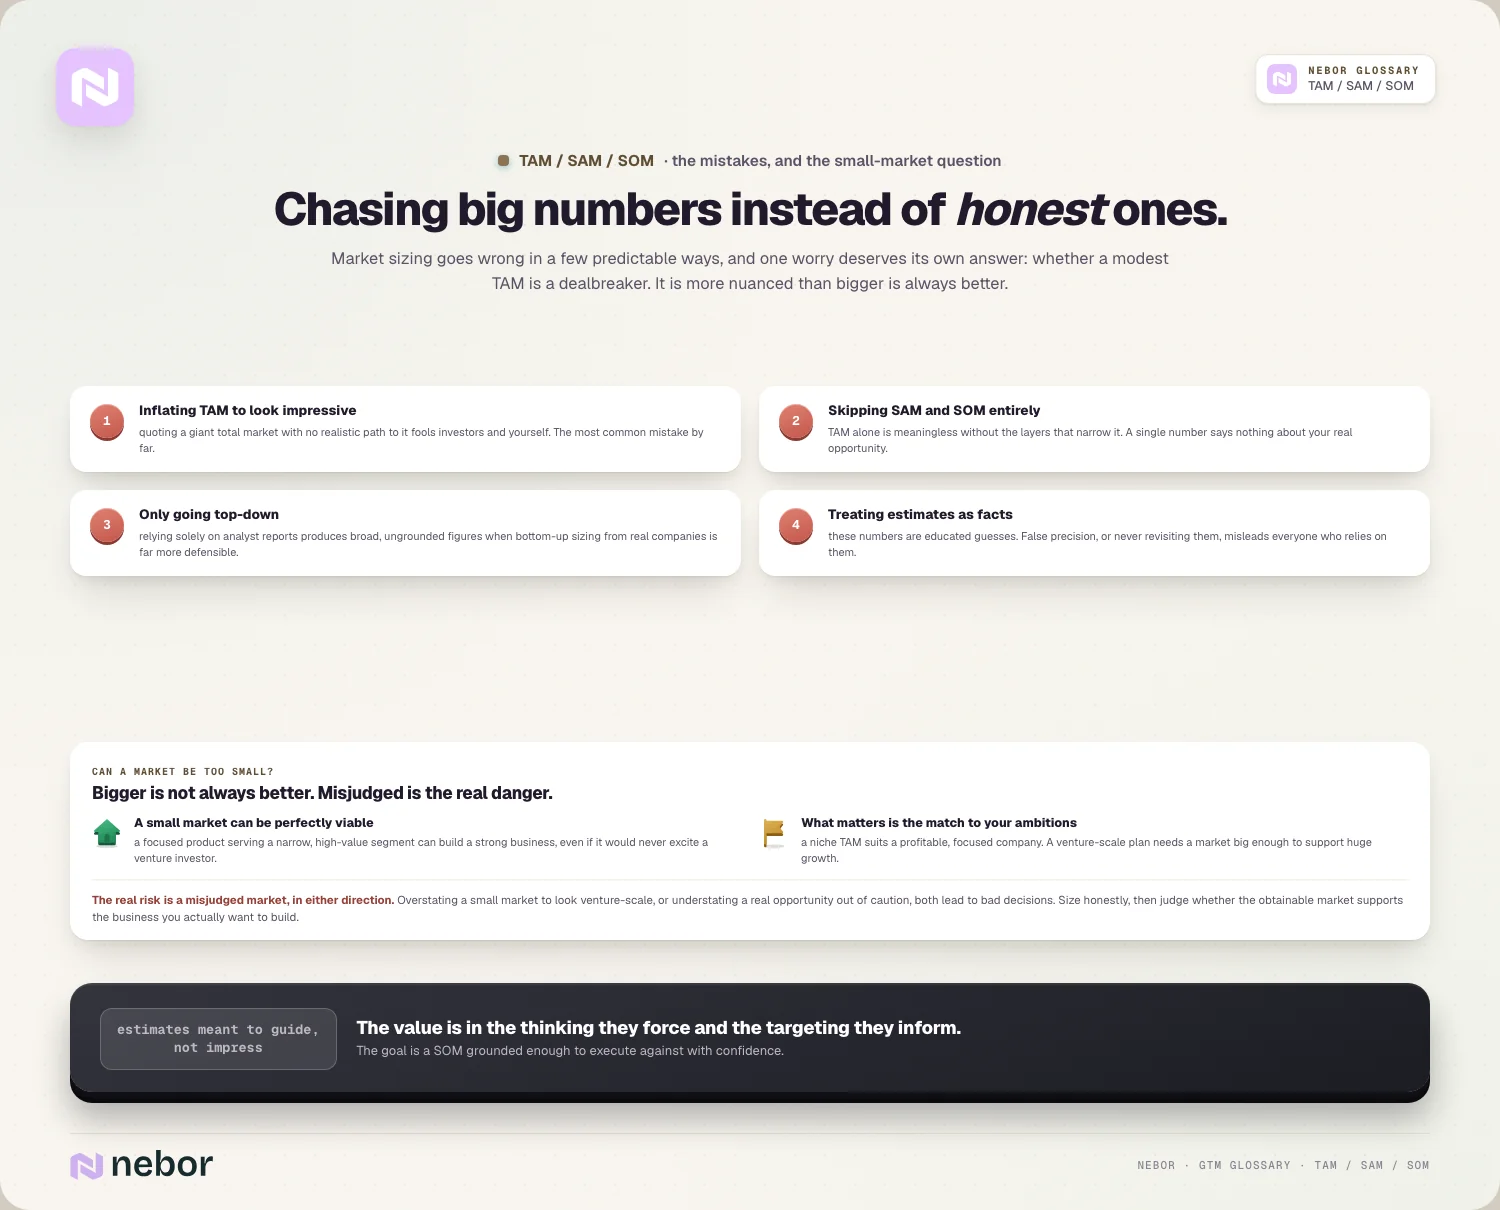
What matters is the match between your market and your ambitions. A niche TAM suits a profitable, focused company, while a venture-scale plan needs a market big enough to support huge growth.
The real risk is a misjudged market rather than a small one. Overstating a small market to look venture-scale, or understating a real opportunity out of caution, both lead to bad decisions.
So size honestly and then judge fit. The question that matters is whether the realistic, obtainable market supports the kind of business you want to build, and an impressive TAM answers none of that.
Why three honest numbers beat one impressive one on every slide
Market sizing matters because it forces honesty about your opportunity. A single big number flatters you, while the three layers together tell you what you can actually win.
The deeper value is in the thinking more than the figures. Working through TAM, SAM, and SOM makes you confront who you really serve and what you can realistically capture, which sharpens every decision downstream.
The honest reality is that these are estimates meant to guide rather than impress. The goal is a SOM grounded enough to plan and execute against with confidence, whatever it does for the slide.
So if your market sizing is one giant number on a slide, it's probably doing more harm than good. Sizing it honestly into TAM, SAM, and SOM is what turns a vague market into a concrete plan.
That honest plan is the foundation a serious go-to-market system is built on. It's why a careful look at your total addressable market is worth doing properly before you scale, especially before you automate sales prospecting against it.
Share this post
Marketing
Data
Prospecting
Glossary
Related glossary items
Understanding the core GTM concepts




Ready to build your pipeline