

In this post:
Imagine reaching out to a prospect already knowing they use your biggest competitor, buy ads with no attribution tool, and just added a system that integrates perfectly with yours. Your message practically writes itself from there.
That's the advantage technographic data makes possible. It tells you what tools a company really uses, which often reveals more about whether they'll buy than their size or industry ever could.
Technographic data is information about the technology a company uses, including its software, platforms, and tools, often called its tech stack. Where other data describes who a company is, technographic data describes what they use.
The reason it's so useful is that a tech stack is a window into needs and fit. The tools a company has, lacks, or is about to outgrow tell you whether your product belongs in their world and why.
TL;DR
Technographic data is data about the technologies a company uses, its tech stack, including software, platforms, and tools, used to judge fit and time outreach.
Tech stacks reveal buying signals that firmographics miss, because knowing a company uses a competitor, lacks a key tool, or already has something that integrates with you tells you exactly how to approach them.
It's gathered by detecting technologies on websites, analyzing job postings, and aggregating vendor data, then tied to each company with a confidence level.
The limitation worth respecting is that technographic data can be incomplete or stale, because tools change and detection isn't perfect. It works as a strong signal to act on instead of a perfect inventory to trust blindly.
So what is technographic data, exactly, and what does it describe?
Technographic data describes the technology a company uses to do business. It's a structured picture of their tech stack, from the software they buy to the platforms they're built on.
It covers a wide range of tools. CRMs, marketing platforms, analytics tools, cloud providers, payment systems, and development frameworks all show up in a company's technographic profile.
Each detected tool is usually tied to the company with extra detail. A good technographic record includes a confidence level and often a record of when the tool was first and last seen, which tells you how current the detection really is.
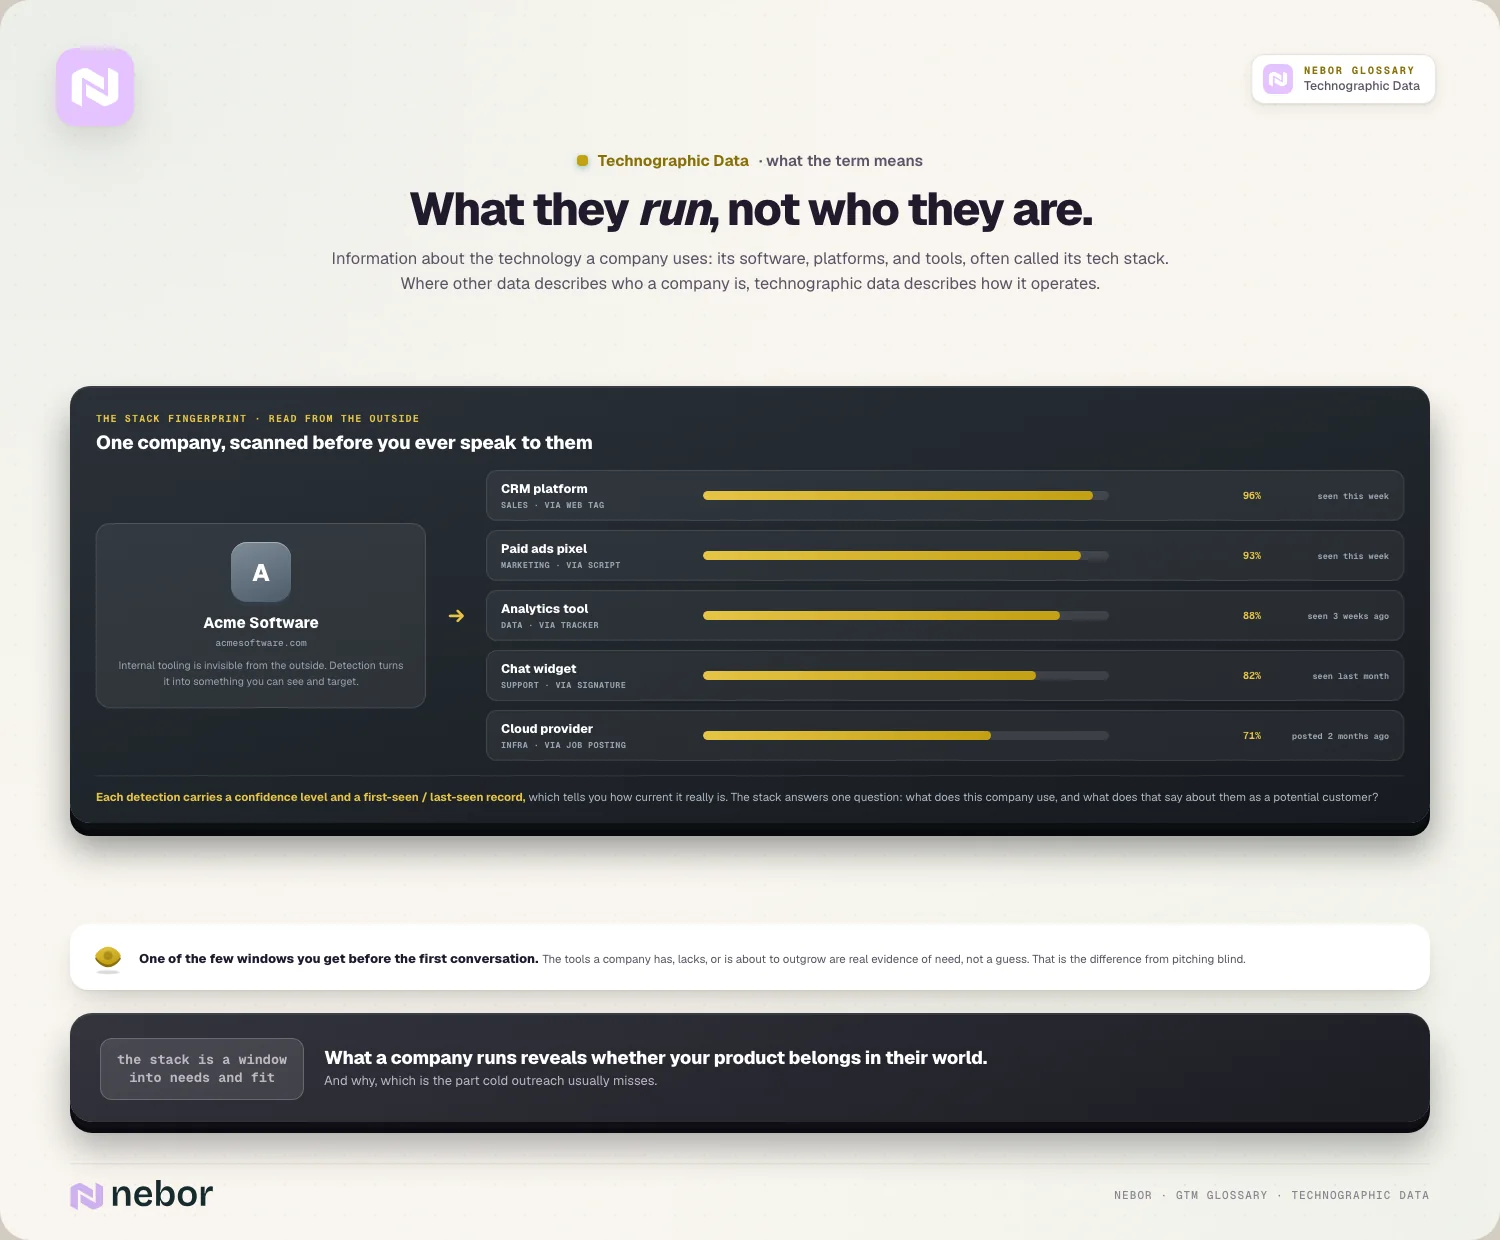
The simplest way to frame it is as the answer to one question. What technology does this company use, and what does that tell me about them as a potential customer?
So technographic data turns an invisible thing, a company's internal tooling, into something you can see and target. That visibility is what makes it so useful for sales and marketing.
It's the difference between guessing what a prospect might need and having real evidence of it. A tech stack is one of the few windows you get into how a company operates before you ever speak to them.
How is technographic data different from the firmographic data next to it?
These two data types are often mentioned together, so it helps to separate them clearly. They describe a company from different angles.
Firmographic data tells you who a company is. Its industry, size, revenue, location, and headcount are the basic facts that describe the organization itself.
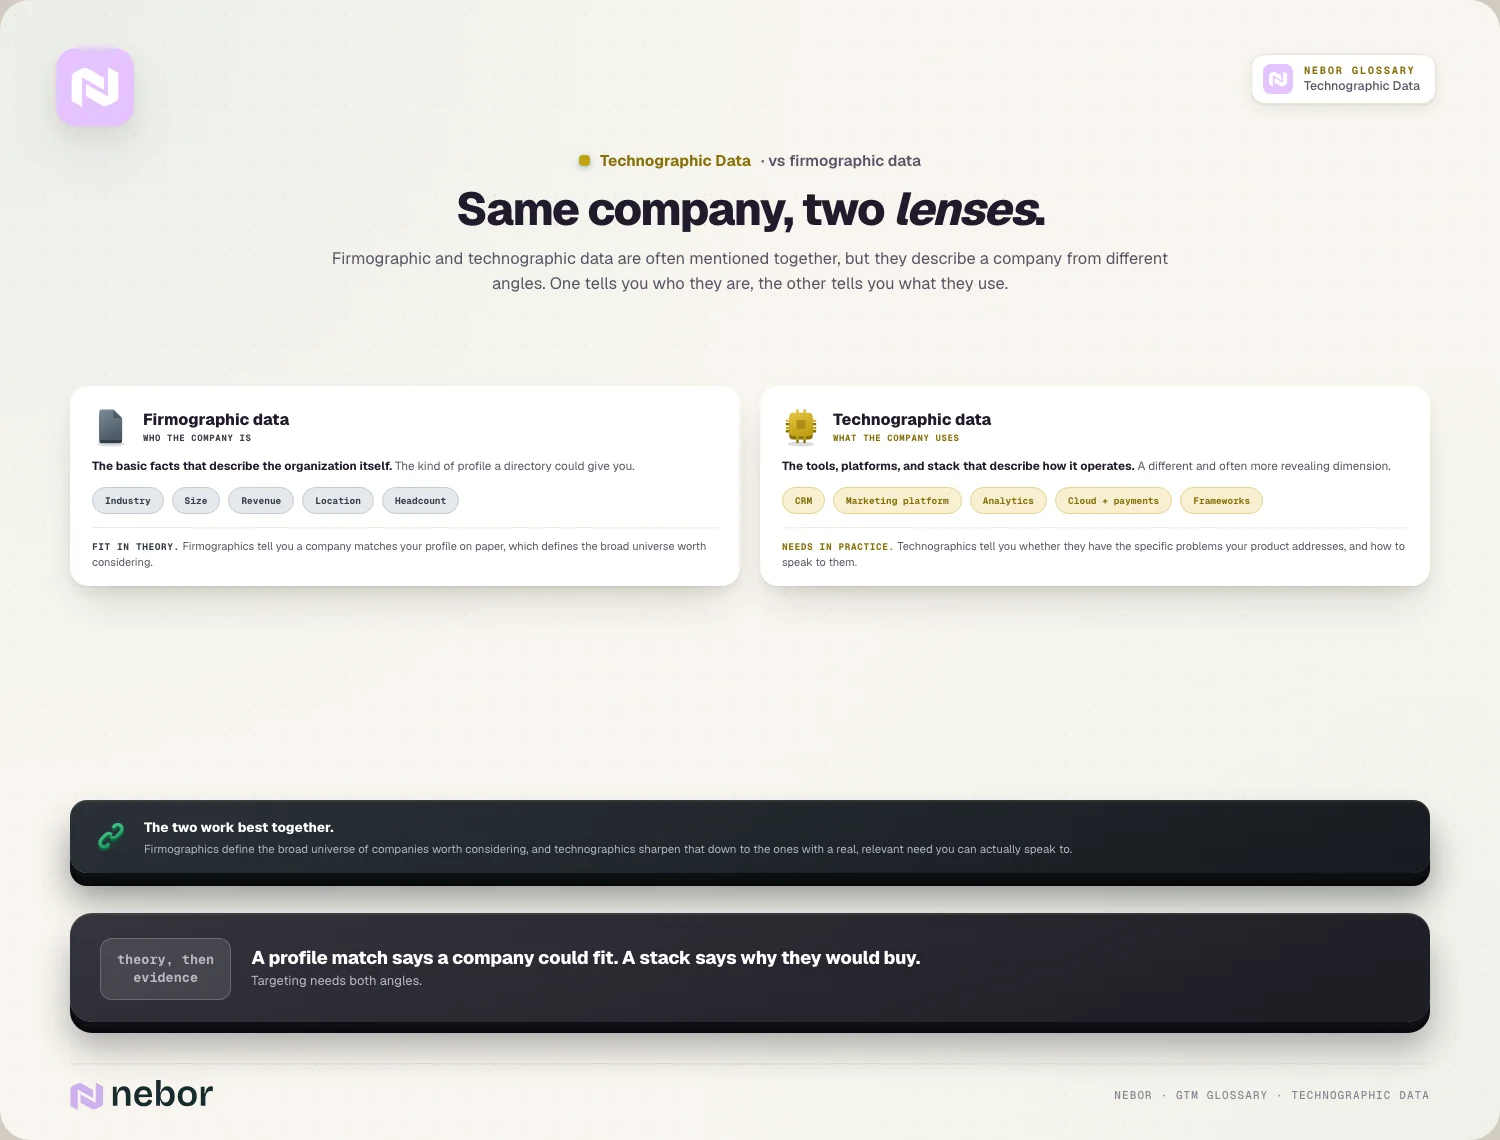
Technographic data tells you what a company uses. Its tools, platforms, and tech stack describe how the company operates, which is a different and often more revealing dimension.
The difference shows up most clearly in targeting. Firmographics tell you a company fits your profile in theory, while technographics tell you whether they have the specific needs your product addresses.
So the two data types work best together. Firmographics define the broad universe of companies worth considering, and technographics sharpen that down to the ones with a real, relevant need you can actually speak to.
How is technographic data gathered, and how much can you trust it?
Understanding where technographic data comes from helps you judge how much to trust it, because a few methods feed most providers.
The most common method is web detection, where crawlers scan company websites for the scripts, tags, and signatures that reveal which tools are installed, like analytics trackers or chat widgets.
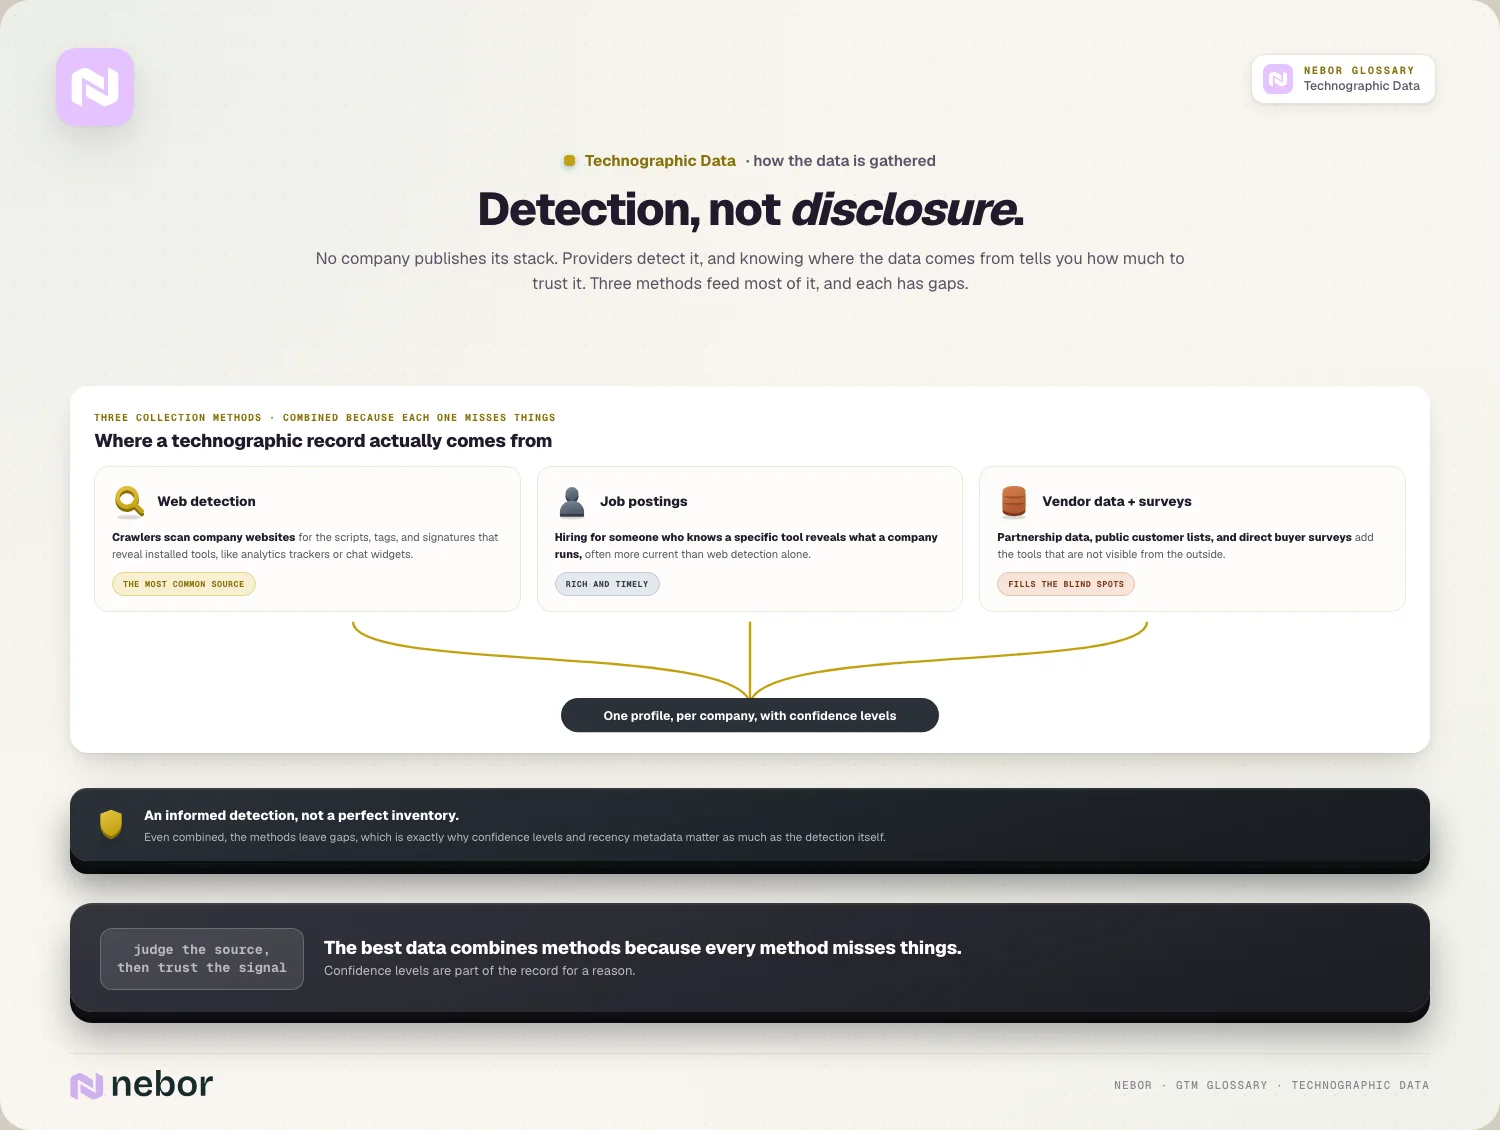
Job postings make another surprisingly rich source. When a company hires for someone who knows a specific tool, that posting reveals what they use, which is often more current than web detection alone.
Vendor data and surveys fill in what the others miss. Partnership data, public customer lists, and direct surveys of buyers add tools that aren't visible from the outside.
Each method has gaps, so the best data combines them. Even then, technographic data remains an informed detection with blind spots, so confidence levels matter.
What can you do with technographic data once you have it in hand?
The real value of technographic data is in how it sharpens targeting and messaging, and in our experience a few use cases stand out.
Competitive displacement is the headline play, because if you know which companies use your competitor, you can build a list of them and reach out with messaging aimed at that competitor's specific weaknesses.
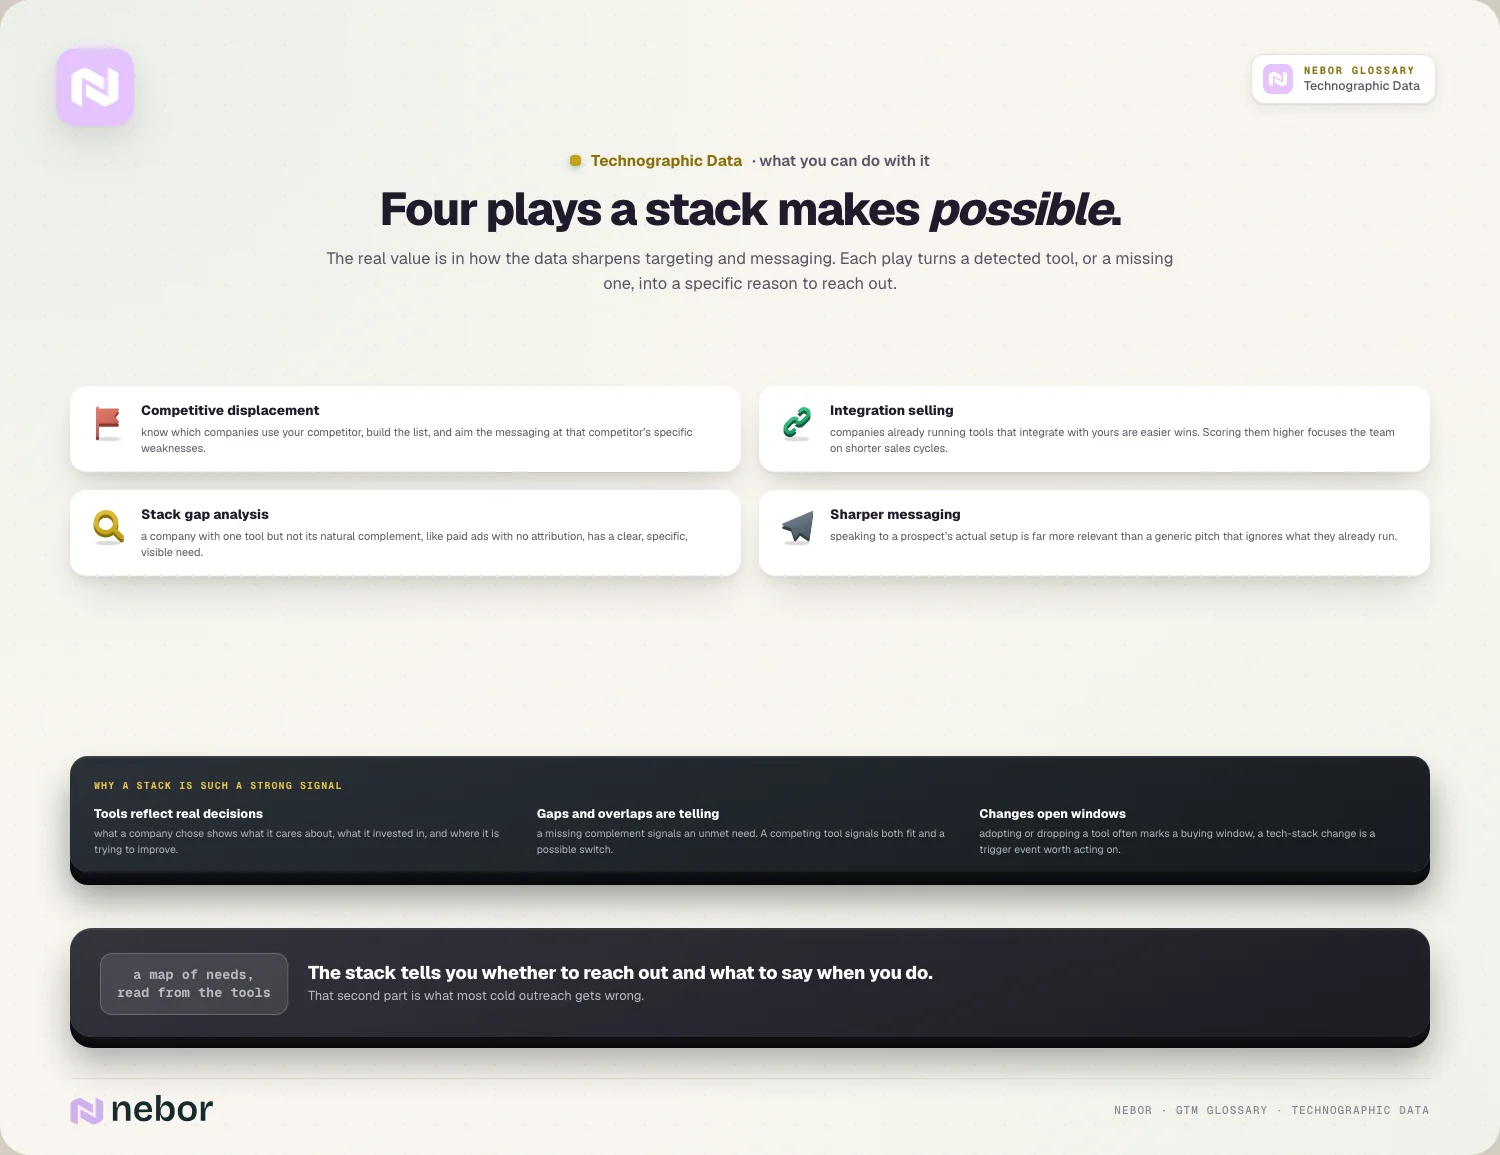
Integration selling is a close second, because companies already using tools that integrate with yours are easier wins, so scoring them higher focuses your team on accounts with shorter sales cycles.
Stack gap analysis surfaces the clearest needs, because spotting a company that has one tool but lacks its natural complement, like paying for ads with no attribution, reveals something specific to say.
And sharper messaging threads through all of it, because knowing a prospect's stack lets you speak to their real setup, which lands far better than a generic pitch that ignores what they already have.
Why is a company's tech stack such a strong signal of buying fit?
Technographic data is powerful because a company's tools reveal intent and fit in ways other data can't, and the reason is simple enough to trace.
A tech stack reflects real decisions someone made. The tools a company chose show what they care about, what they've invested in, and where they're trying to improve, which firmographics never capture.
Gaps and overlaps tell you the most. A missing complementary tool signals an unmet need, while a competing tool signals both fit and a possible switch, both strong buying signals.
Changes in the stack are signals too. A company adopting or dropping a tool is often entering a buying window, which makes a tech-stack change a useful trigger event worth acting on.
So a tech stack is essentially a map of a company's needs. Reading it well tells you not just whether to reach out, but exactly what to say when you do, which is the part most cold outreach gets wrong.
How does technographic data fit into your ICP and your targeting?
Technographic data does its best work as part of how you define and reach your market. It adds a precise dimension to your targeting.
It sharpens your ideal customer profile considerably. Adding tech-stack criteria, like uses a specific platform or lacks a certain tool, makes your ICP far more precise than firmographics alone.
It improves your list building just as directly. Filtering your target list by technology means you reach companies with a real, relevant need instead of just ones that match a broad profile.
It feeds qualification further down the funnel. Using tech-stack fit in your lead scoring helps you prioritize accounts whose tools suggest they're more likely to buy.
So technographics turn a vague target market into a precise one. They let you find not just companies that look right, but companies whose actual setup says they need you.
How does technographic data work alongside enrichment and signals?
Technographic data rarely works alone, combining instead with other data to power modern outbound, and a few connections matter most.
It's a key part of data enrichment. Adding tech-stack details to your records, alongside firmographics, gives you a fuller picture of each account to act on.
It's one input among many in a signal stack. Technographics work alongside intent signals and behavioral data, so a tech-stack fit plus active research is a stronger combination than either alone.
It works as both first- and third-party context. As a form of first-party versus third-party data, technographics are typically third-party detection that complements what you observe directly.
This is the heart of signal-based selling. A tech-stack change or gap is a signal, and acting on it with timely, relevant outreach is exactly how signal-based selling works.
Does technographic data measurably move the numbers that matter?
Clients ask us whether technographic data justifies the spend, and the evidence suggests it does. When teams use it well, it shows up in results.
The performance gains are real and measured. Sales teams using tech-stack data report around 27% shorter sales cycles and 34% higher conversion rates, because they reach better-fit accounts with sharper messaging.
Adoption numbers point in the same direction. Roughly 45% of B2B companies use technographic data for account targeting, alongside firmographic and predictive data.
The reason it works comes down to relevance. Reaching companies whose tools reveal a genuine need, with a message tuned to their setup, simply converts better than spraying a broad list and hoping a few of them happen to care.
So technographic data amounts to more than a nice-to-have detail. It's a targeting and messaging advantage that measurably improves outbound when teams put it to work.
What does technographic targeting look like in an actual outbound play?
A concrete example makes the value clearer, because the use cases stay abstract otherwise. Here's how a single piece of technographic data changes an outbound play.
Say you sell attribution software, for example. You pull a list of companies using paid advertising tools but have no attribution tool detected in their stack. That gap is your exact ideal customer.
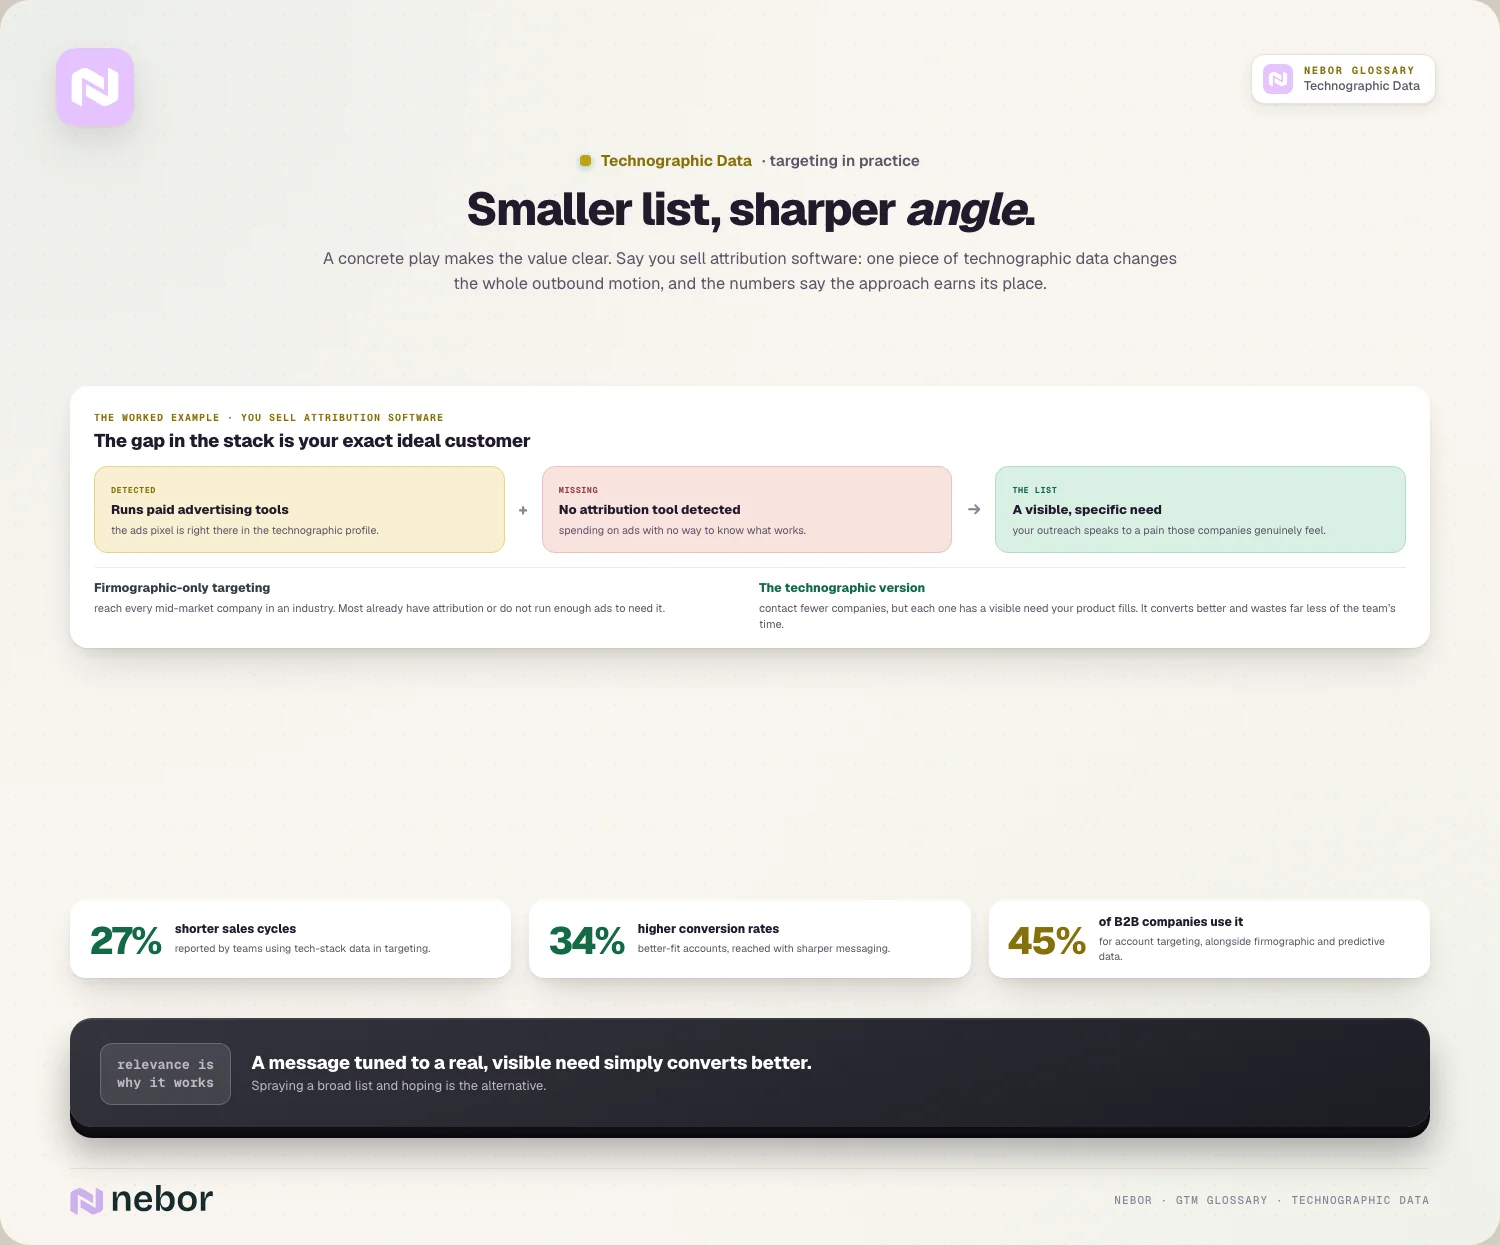
Now your outreach has a real angle. Instead of a generic pitch, you can speak to the specific problem of spending on ads without knowing what works, which is a pain those companies feel every month.
Compare that to a firmographic-only version of the play. You'd reach every mid-market company in an industry, most of whom either already have attribution or don't spend enough on ads to need it.
The technographic version is smaller, sharper, and far more relevant. You contact fewer companies, but each one has a visible, specific need your product fills, and that focus converts better while wasting far less of your team's time.
How accurate is technographic data, and how do you handle gaps?
Accuracy is the honest weak point of technographic data, and knowing how to work with that keeps it useful, because the data is helpful but never perfect.
Detection misses real things all the time. Tools that don't leave a visible footprint, or are used internally without touching the website, often go undetected, so absence in the data doesn't always mean absence in reality.
Data goes stale as well, because companies adopt and drop tools constantly, so a detection from a year ago may no longer be true, and recency metadata exists exactly for this.
The way to handle this is to treat technographics as probabilities instead of certainties. A high-confidence, recent detection is strong, while an old or low-confidence one deserves more caution.
So you act on the data while expecting some noise. Combining it with other signals and verifying the highest-stakes assumptions keeps you from building outreach on a detection that turned out to be wrong.
What are the common mistakes teams make with technographic data?
Technographic data can mislead when it's used carelessly, and in our experience the same few mistakes show up over and over.
Trusting it as complete leads the list, because detection is imperfect and tools change, so treating a technographic profile as a perfect inventory leads to wrong assumptions.
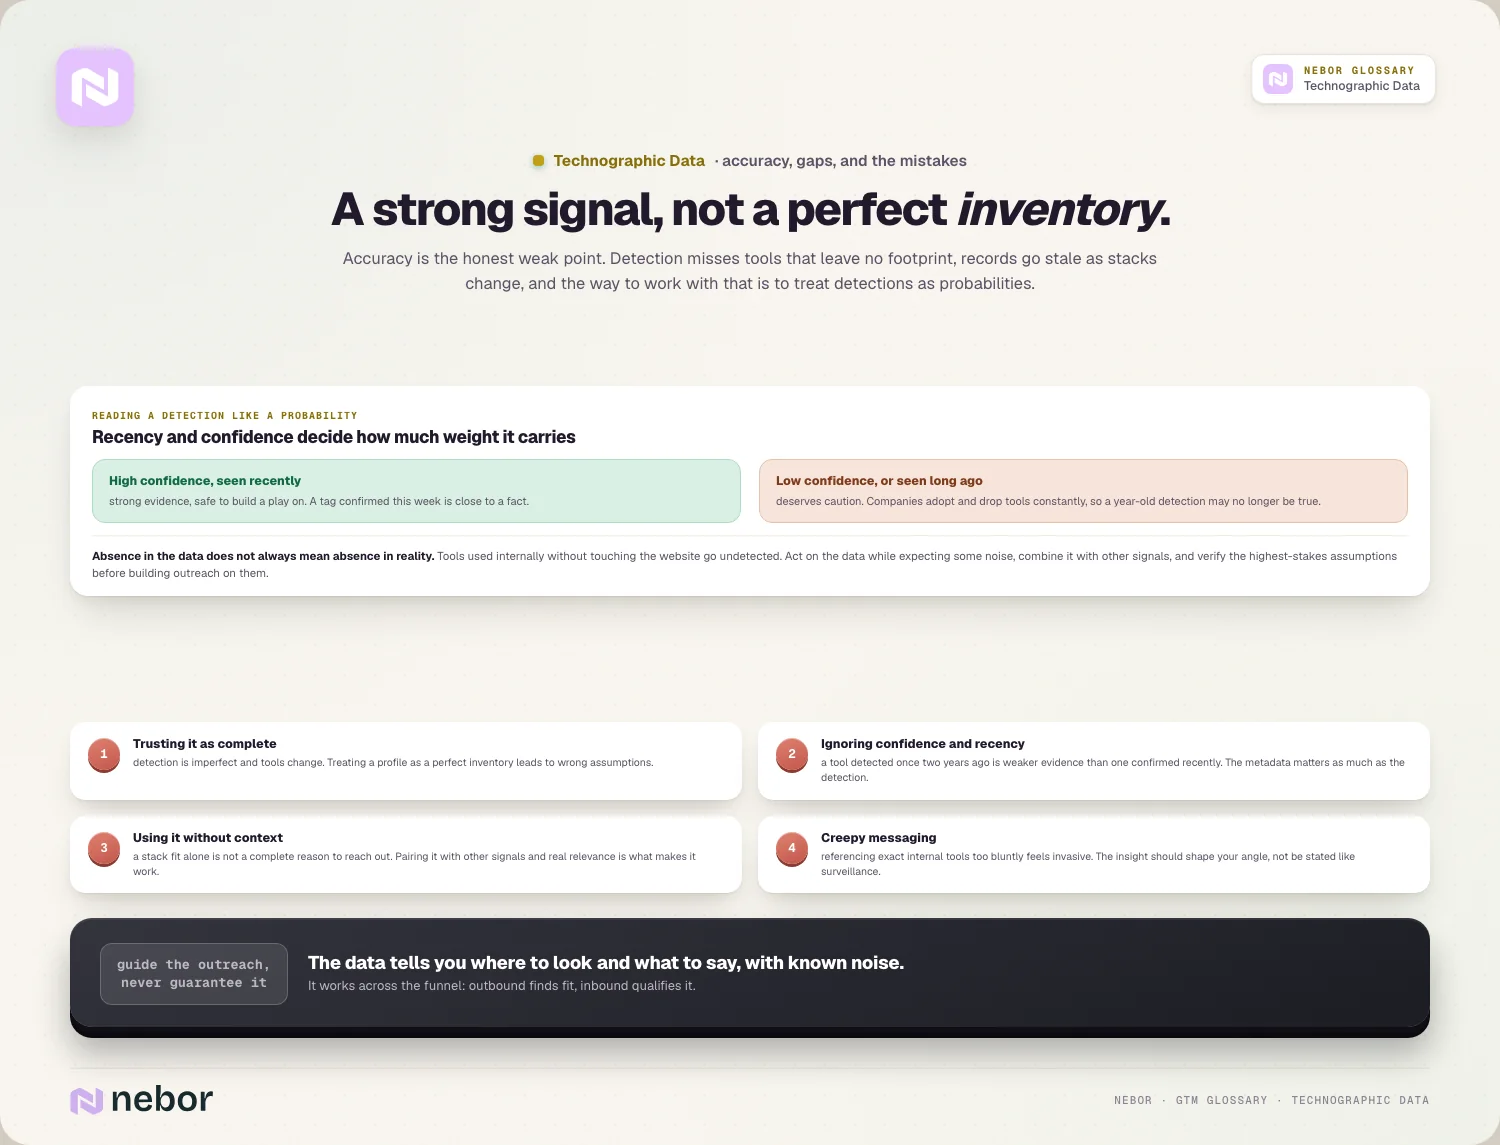
Ignoring confidence and recency comes next, because a tool detected once two years ago is weaker evidence than one confirmed recently, so the metadata matters as much as the detection.
Using it without context weakens the play, because a tech-stack fit alone isn't a complete reason to reach out, so pairing it with other signals and real relevance is what makes it work.
And heavy-handed messaging spoils the advantage, because referencing a prospect's exact internal tools too bluntly can feel invasive, so the insight should shape your angle without being announced.
Does technographic data help your inbound as much as your outbound?
Technographic data is usually framed as an outbound targeting tool, but it sharpens inbound just as much. The moment a lead arrives, knowing their stack helps.
When someone fills out a form, enriching them with technographic data instantly tells you more about their fit. You learn what they're using before the first conversation, so you walk in informed.
It helps you prioritize inbound as well. Two leads might look identical on paper, but the one whose stack reveals a clear gap your product fills is the better bet to chase first.
And it personalizes the response you send. Knowing an inbound lead's tools lets your follow-up speak to their actual setup, which makes a fast reply feel relevant rather than generic.
So technographic data works across the whole funnel. On outbound it finds the right accounts, and on inbound it qualifies and personalizes the interest you've already earned.
Why reading a company's tech stack finds the buyers your filters miss
Technographic data matters because a company's tools reveal what firmographics can't, which is what they actually need. The stack a company builds is a map of its priorities, gaps, and buying windows.
The deeper value is the relevance it buys. Knowing what a prospect uses lets you reach the right accounts with the right message, and that's the reason tech-stack targeting consistently shortens cycles and lifts conversion.
The honest caveat is that the data guides rather than guarantees. Detection has gaps and tools change, so technographics shape your outreach without promising a perfect picture of what's inside a company.
So if your targeting still leans only on industry and size, you're leaving one of the clearest signals of fit on the table. Reading a company's tech stack is how you find the accounts that genuinely need you.
That precision is exactly what a modern go-to-market system is built to act on. It's also a natural input when you automate sales prospecting at scale, because the data can drive both who you target and what you say.
Share this post
Data
Glossary
Related glossary items
Understanding the core GTM concepts




Ready to build your pipeline