

In this post:
Two SaaS companies each added two million dollars of recurring revenue last quarter, so on the surface they grew at the same rate. Look deeper and one won three million while bleeding a million to churn, while the other won two million and lost nothing, two very different businesses behind one number.
Net new ARR is the single metric that captures that real change. Rather than counting only what you won or only what you lost, it nets every gain against every loss to tell you how much your recurring revenue moved in a period, the number that says whether the business is truly growing.
Net new ARR is the net change in your annual recurring revenue over a period, calculated by taking the recurring revenue you added from new and expanding customers and subtracting what you lost to contraction and churn. It's the bottom-line figure that shows how much your recurring base grew or shrank.
The reason it's so widely trusted is that it can't be flattered by strong sales alone. A team can post huge new business and still have flat net new ARR if churn is eating it, so the metric forces new business and retention into the same number, and that forcing is exactly what makes it an honest read on growth.
TL;DR
Net new ARR is the net change in recurring revenue over a period, adding what you gained from new and expansion and subtracting what you lost to contraction and churn.
The formula is New ARR plus Expansion ARR minus Contraction ARR minus Churn ARR, so it combines go-to-market performance and retention health into one number.
It beats gross new ARR as a growth signal because it can't hide churn, because a business winning lots of new business while leaking customers shows the truth in its net figure.
The composition matters as much as the total, because net new ARR built on durable expansion is far healthier than the same figure propped up by new logos replacing churned ones.
What net new ARR measures and what the word net is doing in the name
The key to net new ARR is the word net, which signals that the metric accounts for both gains and losses instead of just one side. Gross new ARR counts only the recurring revenue you added, while net new ARR subtracts everything you lost in the same period, so it reflects the true movement of your recurring base.
This is important because a recurring revenue business loses revenue every period as well as gaining it. Customers downgrade, cancel, and shrink even as new ones sign and existing ones expand, so measuring only the inflows paints a picture that ignores the leak, which net new ARR refuses to do.
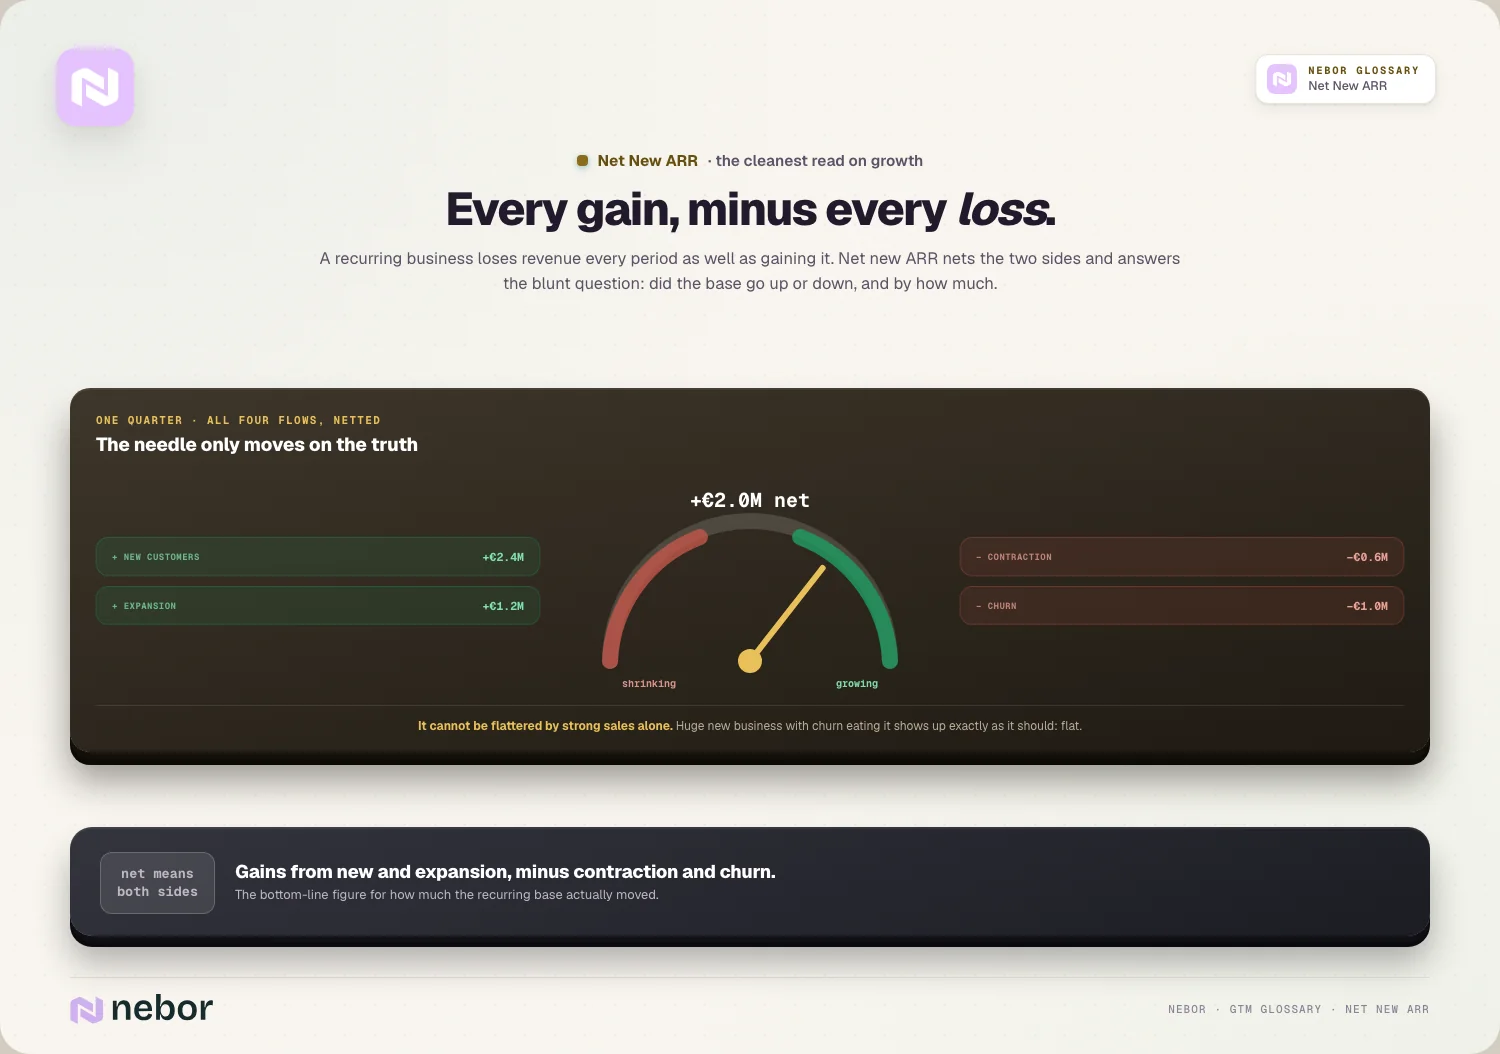
Net new ARR answers one blunt question, whether your recurring revenue went up or down and by how much. Everything else about the metric is detail, but that single netted figure is the clearest statement of whether the business grew its durable revenue base over the period.
The formula and each of the components that flow into net new ARR
The standard formula is New ARR plus Expansion ARR minus Contraction ARR minus Churn ARR, and each component captures a distinct force. New ARR is the recurring revenue from customers who signed for the first time, the classic output of your new-business engine.
Expansion ARR is the additional recurring revenue from existing customers who grew, through upgrades, added seats, or higher usage, one reason expansion revenue is such a powerful lever. Together, new and expansion make up the positive side of the equation, the total recurring revenue you added in the period.

The negative side captures the two ways you lose recurring revenue. Contraction ARR is revenue lost from customers who stayed but shrank, and churn ARR is revenue lost from customers who left entirely. Some teams add restart ARR for churned customers who resubscribe, but the core is these flows netted together.
Why net new ARR is a better growth signal than gross new ARR alone
Gross new ARR is a tempting number to lead with because it's always the largest and most flattering. It shows everything your team won without any of the losses, which makes it useful for measuring sales performance but dangerous as a stand-in for actual growth, because it ignores half the story.
The problem, and we keep seeing it in the decks founders share with us, is that a business can post impressive gross new ARR while barely growing.

If churn and contraction are eating most of what sales wins, the gross figure looks healthy while the net figure is flat, so reporting gross new ARR as growth badly overstates how the business is doing.
Net new ARR closes that gap by refusing to hide the losses. Because it subtracts churn and contraction, it can't be inflated by strong sales alone, which makes it the number that tells you whether all that new business is adding to the base or merely replacing what leaked out.
Why the composition of your net new ARR matters as much as the total
Two identical net new ARR figures can describe completely different levels of business health, so the total alone isn't enough. A team that reached its number through steady expansion of a loyal base is in a far stronger position than one that hit the same figure by winning new logos as fast as it churns old ones.
The difference is durability, and it shows up in the mix. Growth driven by expansion compounds, because it comes from customers who are staying and growing, whereas growth that leans entirely on new business is a treadmill that gets harder as the churned base you must replace keeps growing underneath you.
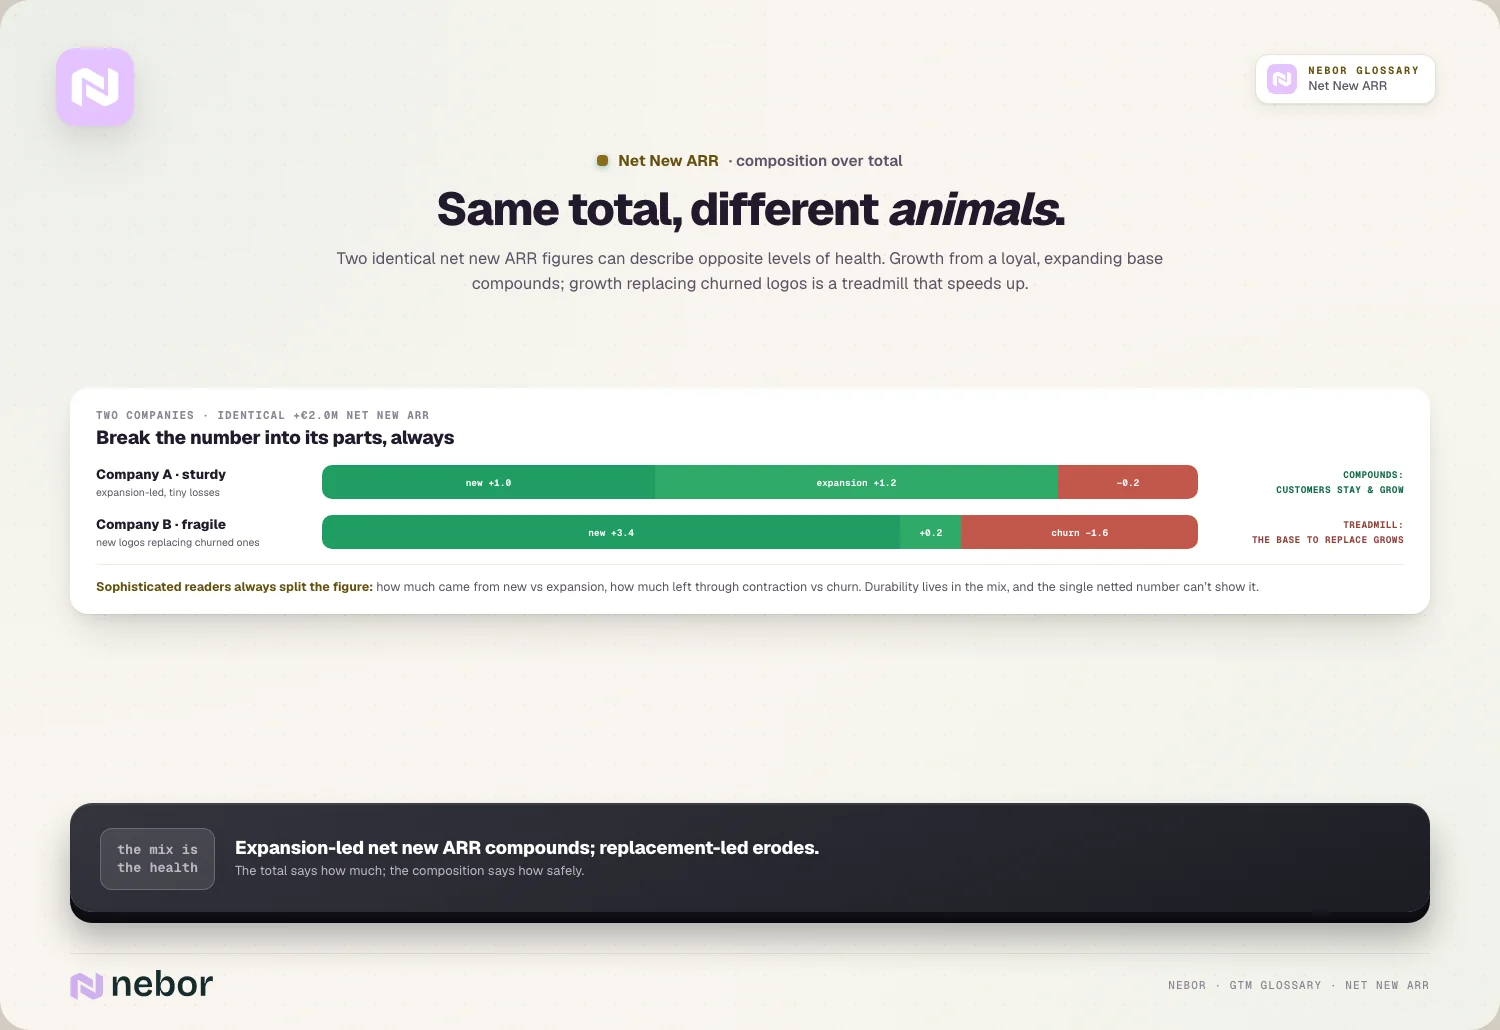
This is why sophisticated readers always break net new ARR into its parts. Seeing how much came from new business versus expansion, and how much was lost to contraction versus churn, reveals whether your growth is sturdy or fragile, which the single netted number can never show on its own.
How net new ARR relates to the revenue waterfall and retention metrics
Net new ARR and the revenue waterfall are two views of the same reality, one as a number and one as a picture. The waterfall lays out each component visually from starting to ending ARR, while net new ARR is simply the net result of all those columns expressed as a single figure.
The same components also feed your retention metrics, so the numbers are deeply connected. Net revenue retention is calculated from expansion, contraction, and churn against your starting base, which are the exact same flows that make up the negative and expansion parts of net new ARR.
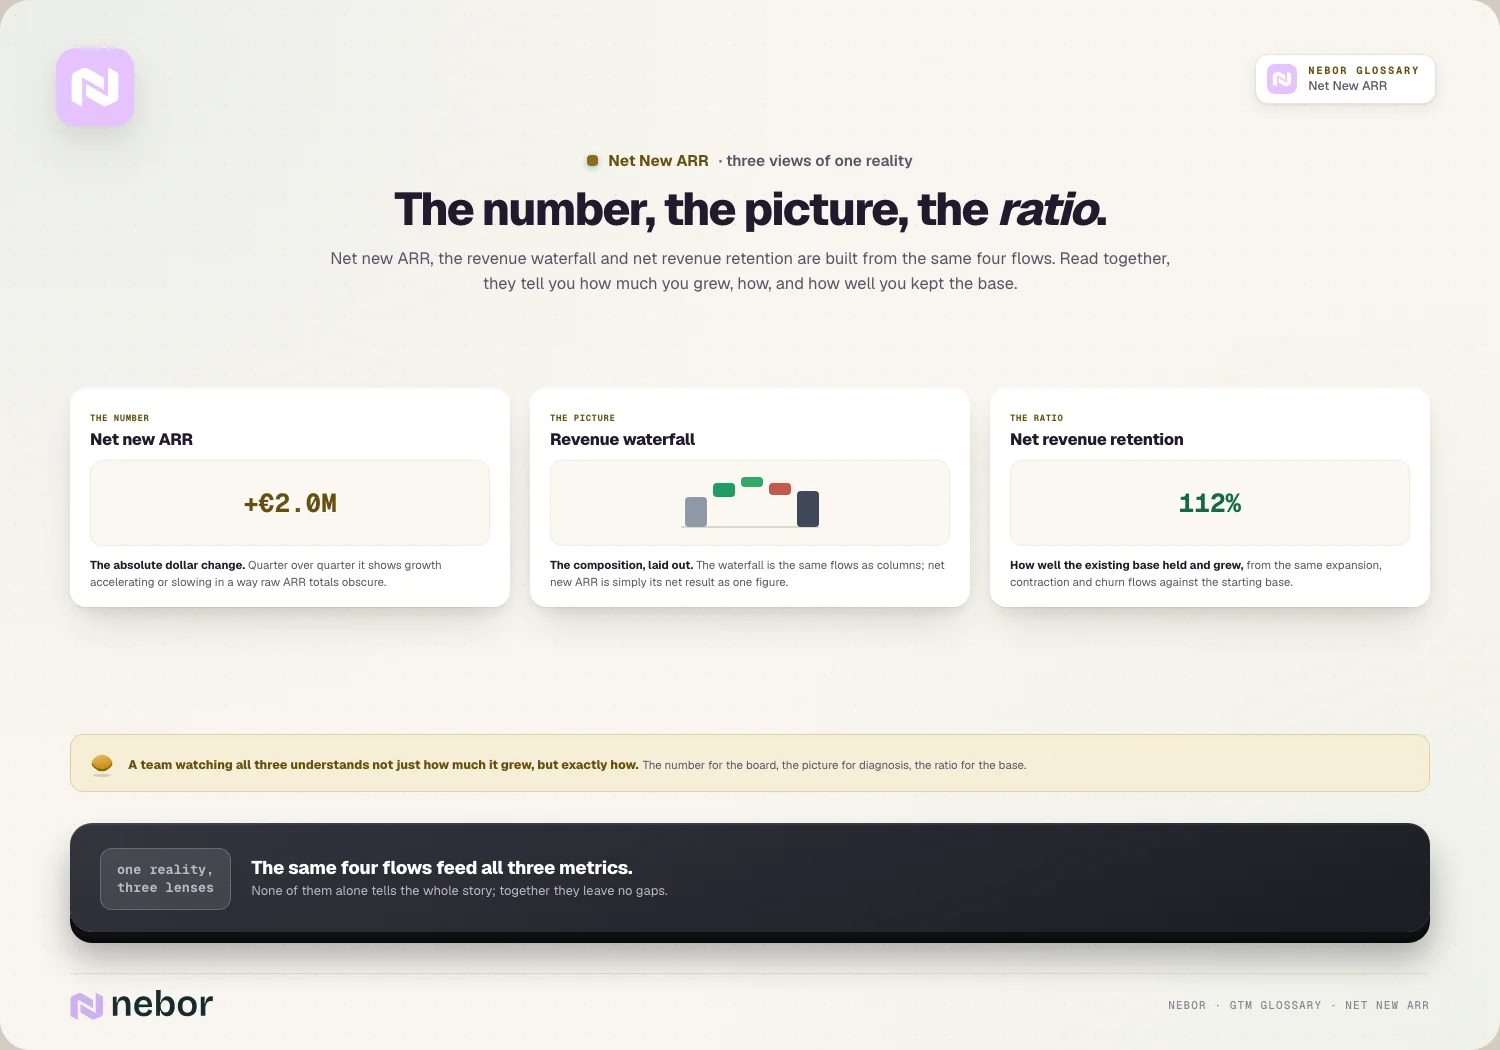
Reading them together gives a complete picture that neither provides alone. Net new ARR tells you the absolute dollar change, retention tells you how well you kept and grew the existing base, and the waterfall shows the composition, so a team that watches all three understands not just how much it grew but exactly how.
Why investors and boards treat net new ARR as the cleanest proxy for durable growth
Public SaaS investors and private boards lean on net new ARR because it resists the flattery that fools other metrics. It combines go-to-market efficiency and retention health into one figure, so a company can't look healthy on net new ARR while falling apart on churn behind the scenes, which makes it hard to game.
That resistance to manipulation is exactly why it's trusted as a growth proxy. Bookings can be inflated by multi-year deals and gross new ARR ignores churn, but net new ARR reflects the real movement of the durable revenue base, so it's the number sophisticated readers reach for when they want the truth.
It also travels well across time and companies because it's a clean measure of change. Comparing net new ARR quarter over quarter shows whether growth is accelerating or slowing in a way that raw ARR totals obscure, and that clarity is why it anchors so many board conversations about the health of the revenue engine.
How to put net new ARR to work when you steer and plan the business
Net new ARR is most useful when you track it over time and watch its trend instead of treating any single quarter as the whole story. A rising net new ARR means growth is accelerating, a falling one means it's slowing, and the direction of that line is often more telling than the absolute figure in any one period.
Breaking the target into its components makes planning far sharper, and we advise clients to set the pieces separately.
If you need a certain net new ARR next year, you can work backward into how much has to come from new business versus expansion and how much churn you can afford, which turns a vague growth goal into a concrete plan tied to quota attainment and retention targets.
The metric also tells you where to invest when growth stalls. A weak net new ARR driven by high churn points at retention and product, while one driven by thin new business points at the top of the funnel, so the composition guides whether to fix the leak or feed the pipeline coverage instead of guessing.
Why net new ARR and your unit economics have to be read side by side
Net new ARR tells you how much the base grew, but not how efficiently, so it belongs next to your unit economics. A company can post strong net new ARR while your pipeline burns unsustainable spend to get it, so the figure only means healthy growth when the cost of acquiring it is in line.
This is where net new ARR connects to the economics of retention. When churn is high, each dollar of net new ARR costs more because you're constantly replacing lost revenue, which drags on your LTV to CAC ratio and makes growth more expensive than the headline figure suggests.
Reading the two together keeps you honest about the quality of growth. Strong net new ARR built on efficient acquisition and low churn is the real prize, whereas the same figure bought with heavy spending and heavy churn is a warning, so the metric is a starting point for the health check instead of the whole verdict.
The common mistakes teams make when they start tracking net new ARR
The most common mistake is confusing net new ARR with gross new ARR and celebrating the wrong number. Leading with the gross figure because it's bigger hides the churn that net new ARR would expose, so a team can feel great about growth that is barely happening once the losses are counted.
Another is watching only the total and never the composition. Two quarters with the same net new ARR can mean very different things, so a team that doesn't break the figure into new, expansion, contraction, and churn misses the shift from healthy to fragile growth until it becomes a crisis.
The subtler mistake, and the one the audits we do turn up most, is inconsistent definitions that make the number untrustworthy over time.
If one quarter counts reactivations and another doesn't, or contraction is classified differently period to period, the trend becomes noise, and disciplined revenue operations teams respond by fixing the definitions before they lean on the metric.
Why net new ARR is the single number that keeps a growth story honest
The deepest value of net new ARR is that it strips the optimism out of a growth story by forcing gains and losses into the same figure. It's easy to feel like a business is thriving when sales are strong, but net new ARR keeps asking whether that strength is adding to the base or merely backfilling churn.
That honesty is what makes it the number to organize around, because it can't be satisfied by winning alone. Hitting a net new ARR target requires both a strong top of the funnel and a base that stays and grows, so chasing the metric pushes a team to balance acquisition with retention instead of over-index on one.

A go-to-market system built to grow durably treats net new ARR as its scoreboard instead of gross wins. When the new business you automate sales prospecting to generate lands on a base you're keeping and expanding, the net figure climbs on its own, and the growth it reports is the kind that lasts.
Share this post
RevOps
Glossary
Related glossary items
Understanding the core GTM concepts




Ready to build your pipeline