

In this post:
Two companies each lose ten customers in a month. One barely notices, and the other takes a serious hit to its revenue. The difference is how much money walked out the door with them, far more than how many accounts left, and that's exactly what customer counts miss.
Revenue churn is the metric that captures it. Instead of counting logos lost, it measures the dollars lost, so a single large account leaving registers as the real blow it is rather than as one line among ten.
Revenue churn is the amount of recurring revenue you lose from existing customers over a period, through cancellations and downgrades. It measures churn in the dollars leaving your accounts rather than in headcount, which is what makes it a truer read on financial impact.
The metric comes in two forms that answer different questions. Gross revenue churn counts only the losses, while net revenue churn subtracts the expansion you gained from other customers, and knowing which one someone means matters.
TL;DR
Revenue churn is the recurring revenue lost from existing customers through cancellations and downgrades, measured in dollars rather than in accounts.
It matters more than logo counts for financial health, because losing one large customer can hurt far more than losing several small ones.
It has a gross and a net version, so gross counts only losses while net subtracts expansion revenue, and the two answer different questions.
A healthy business keeps gross revenue churn low, with the median B2B SaaS company losing around 10% of revenue a year before any expansion.
What revenue churn measures compared to plain customer churn
Revenue churn measures lost dollars, and that focus is what sets it apart. It tracks the recurring revenue that leaves instead of the number of accounts.
It counts cancellations and downgrades in the same bucket. When a customer leaves entirely or moves to a cheaper plan, the recurring revenue you lose is what revenue churn captures.
It weights every loss by its size. A customer paying ten times more counts ten times as heavily, so revenue churn reflects the real financial impact of who left.
It differs sharply from plain logo churn. The customer churn rate counts accounts lost regardless of size, so it can look identical whether you lost whales or minnows.
So revenue churn and customer churn answer different questions. One tells you how many customers left, and the other tells you how much money left, so a full picture needs both.
The distinction is often invisible on a dashboard. A single churn percentage rarely says whether it counts logos or dollars, so check exactly which one you're looking at before you draw any conclusion from it.
Why losing one large customer can outweigh losing many small ones
The core reason revenue churn exists is that not all lost customers are equal. A single big account can matter more than a crowd of small ones.
Dollars are what fund the business, in the end. Losing one customer paying a large amount can hurt more than losing five small ones, because the revenue impact is what shows up in your finances.
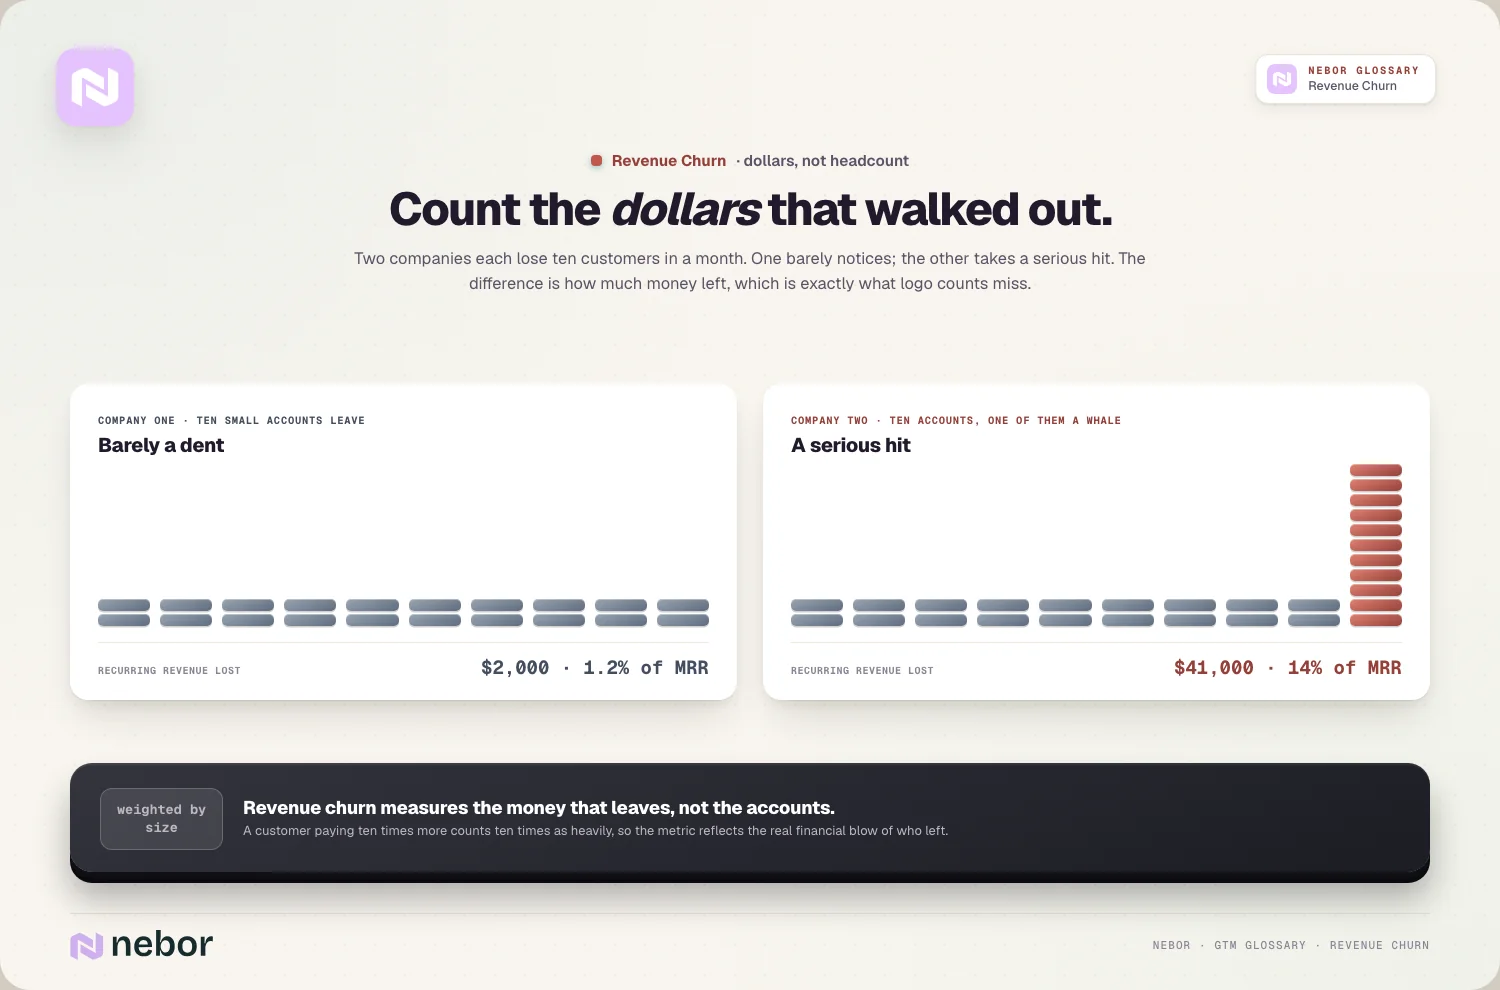
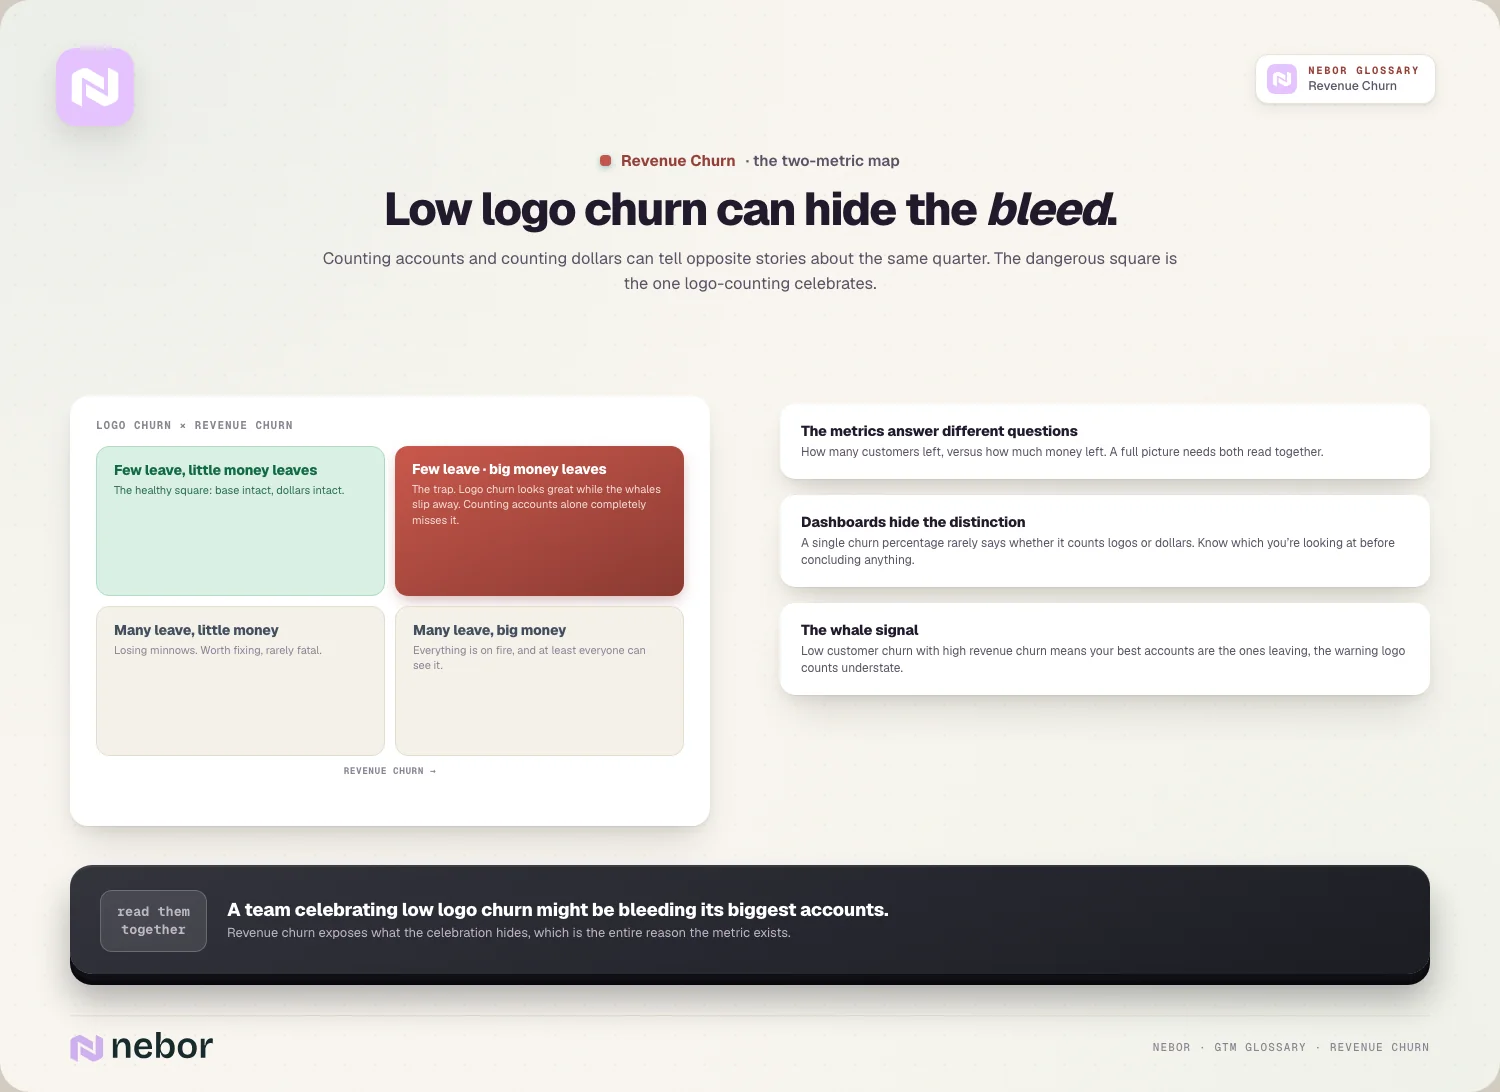
Customer churn hides this from you completely. A team celebrating a low logo churn rate might still be bleeding revenue if the accounts leaving are its biggest ones.
Revenue churn exposes it in plain sight. Because it weights by dollars, a departing whale registers as the major event it is, which customer churn would understate.
So the two metrics can tell opposite stories. Low customer churn with high revenue churn means you're losing your best accounts, which is a warning that counting logos alone would completely miss.
What the real difference is between gross and net revenue churn
Revenue churn splits into two versions, and confusing them leads to very different conclusions. The distinction is whether expansion offsets the losses.
Gross revenue churn counts only the losses. It measures all the recurring revenue lost to cancellations and downgrades, with no credit for revenue gained elsewhere.
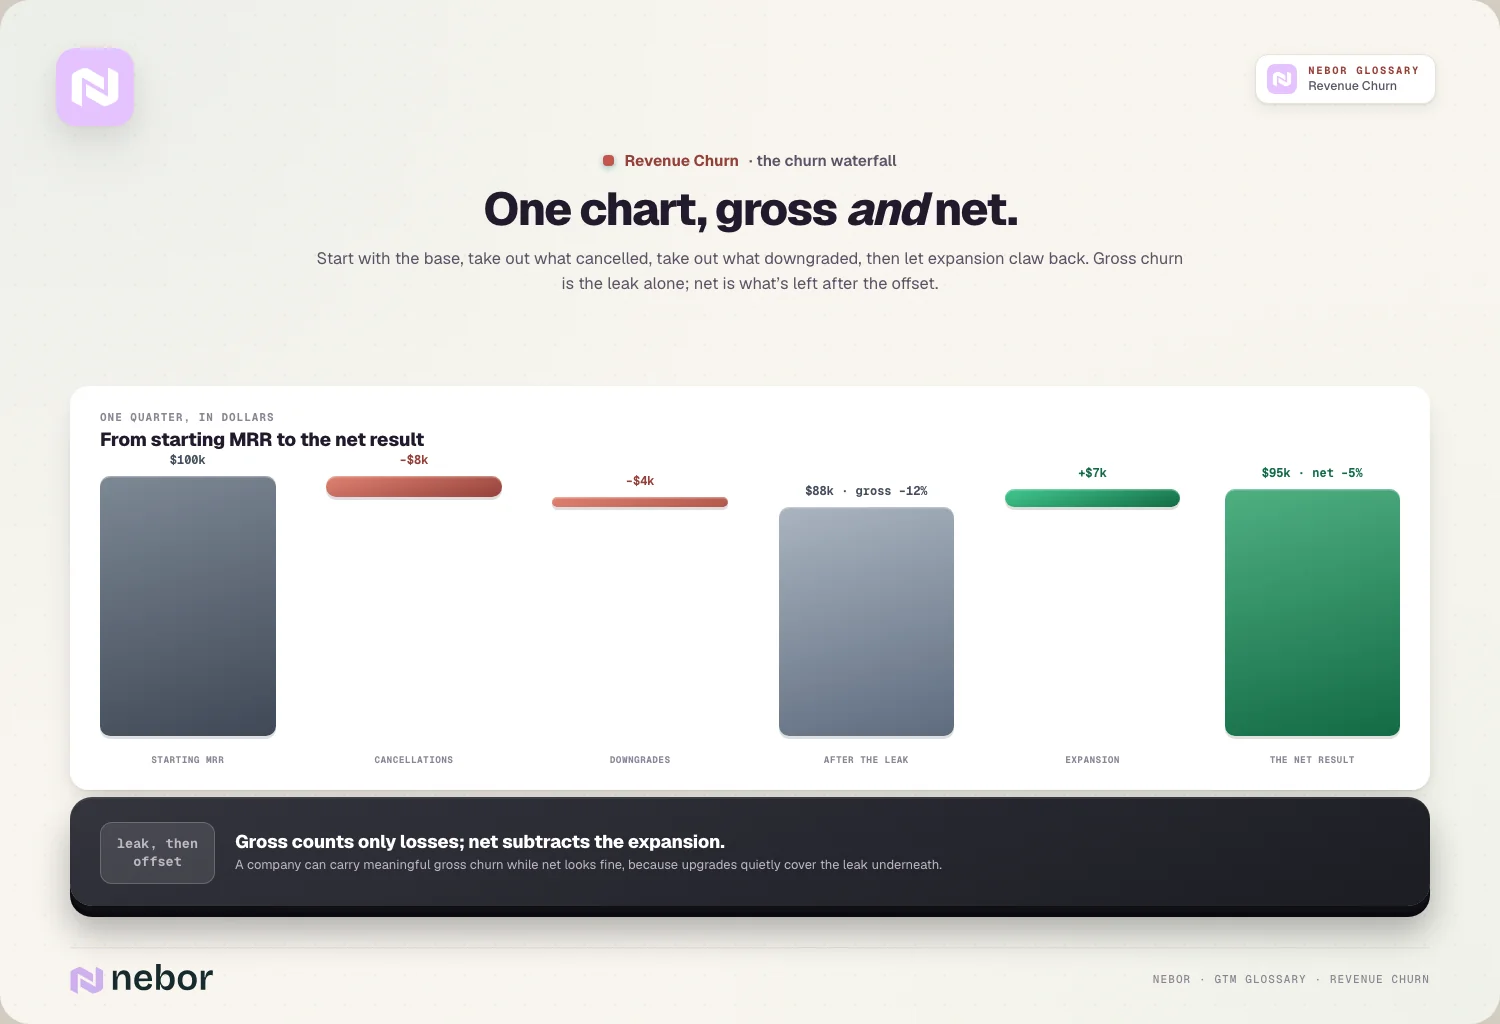
Net revenue churn subtracts the expansion you gained. It takes those losses and offsets them with the expansion revenue from customers who upgraded, so it can even turn negative when expansion outweighs churn.
The two versions measure genuinely different things. Gross tells you pure leakage from your base, while net tells you whether your existing base is shrinking or growing overall.
So you specify which version you mean. A company can have meaningful gross revenue churn while its net churn looks fine, because expansion is covering the losses underneath.
How revenue churn relates directly to gross revenue retention
Revenue churn and one of the most watched retention metrics describe the same fact from opposite directions. One is simply the mirror of the other.
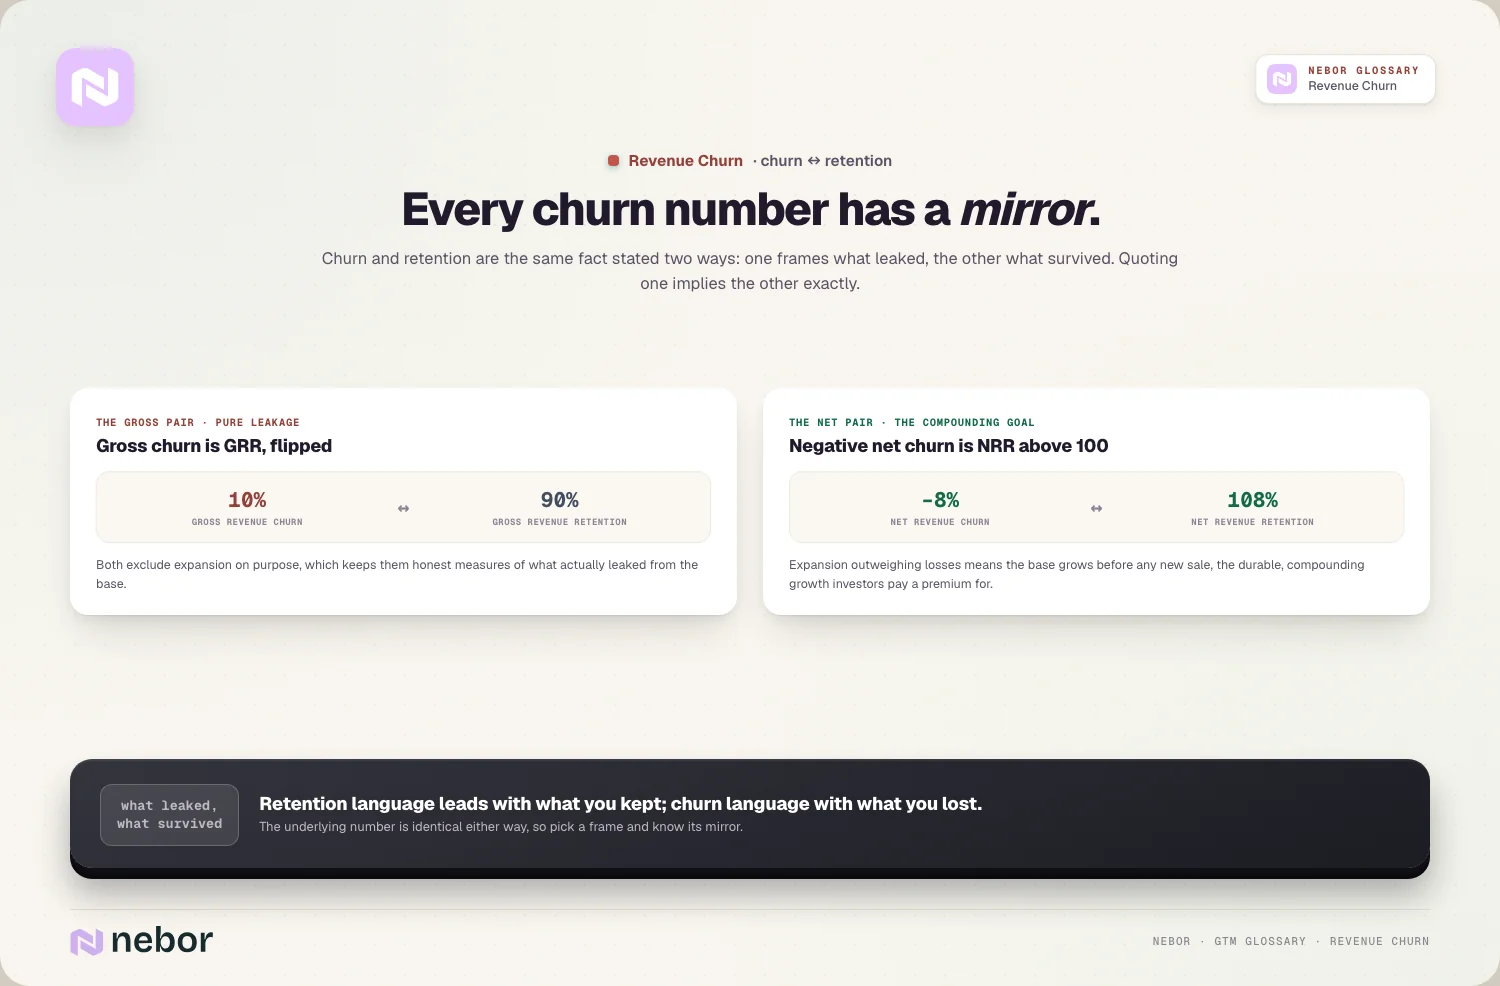
Gross revenue churn is the exact inverse of retention. Where gross revenue retention measures the share of revenue you keep, gross revenue churn measures the share you lose, so they add up to the whole.
The math between them is completely direct. A 90% gross revenue retention means a 10% gross revenue churn, so quoting one implies the other exactly.
Both figures exclude expansion, quite deliberately so. Neither the gross retention nor the gross churn figure counts upsell, and that exclusion keeps them honest measures of pure leakage.
So gross revenue churn and gross revenue retention are the same fact stated two ways. One frames it as what survived, the other as what leaked, and you'll see both used interchangeably.
Which framing you use often reflects your mindset. Retention language tends to lead with what you kept, while churn language leads with what you lost, but the underlying number is identical either way.
How net revenue churn connects to the net revenue retention number
The net version has its own mirror metric, and the pairing is just as tight. Net revenue churn is the flip side of the growth-oriented retention number.
Net revenue retention captures the fuller picture. Net revenue retention measures how your existing base changes overall, counting churn, downgrades, and expansion together.
Negative net churn is the number to chase. When expansion outweighs losses, net revenue churn goes negative, which is the same thing as net revenue retention above 100%.
That combination is quietly powerful for growth. A base that grows on its own, even before new sales, is what negative net churn describes, and it's the mark of a strong recurring-revenue business.
Investors watch this one more closely than most. Negative net revenue churn signals that a company can grow simply by keeping and expanding its existing customers, which is exactly the durable, compounding growth buyers pay a premium for.
So net revenue churn and net revenue retention describe the same dynamic. One counts it as net loss and the other as net retention, and both reveal whether your base is compounding or eroding.
What counts as a healthy level of revenue churn when you sell B2B
Benchmarks give you a sense of where you stand, though they vary by who you sell to, and in our experience the median offers a useful anchor.
The typical figure is around 10% a year. The median B2B SaaS company lands near 90% gross revenue retention, implying roughly 10% annual gross revenue churn.
Top performers lose far less than that. Companies above 93% gross revenue retention, meaning under 7% churn, fall into the strongest cohort.
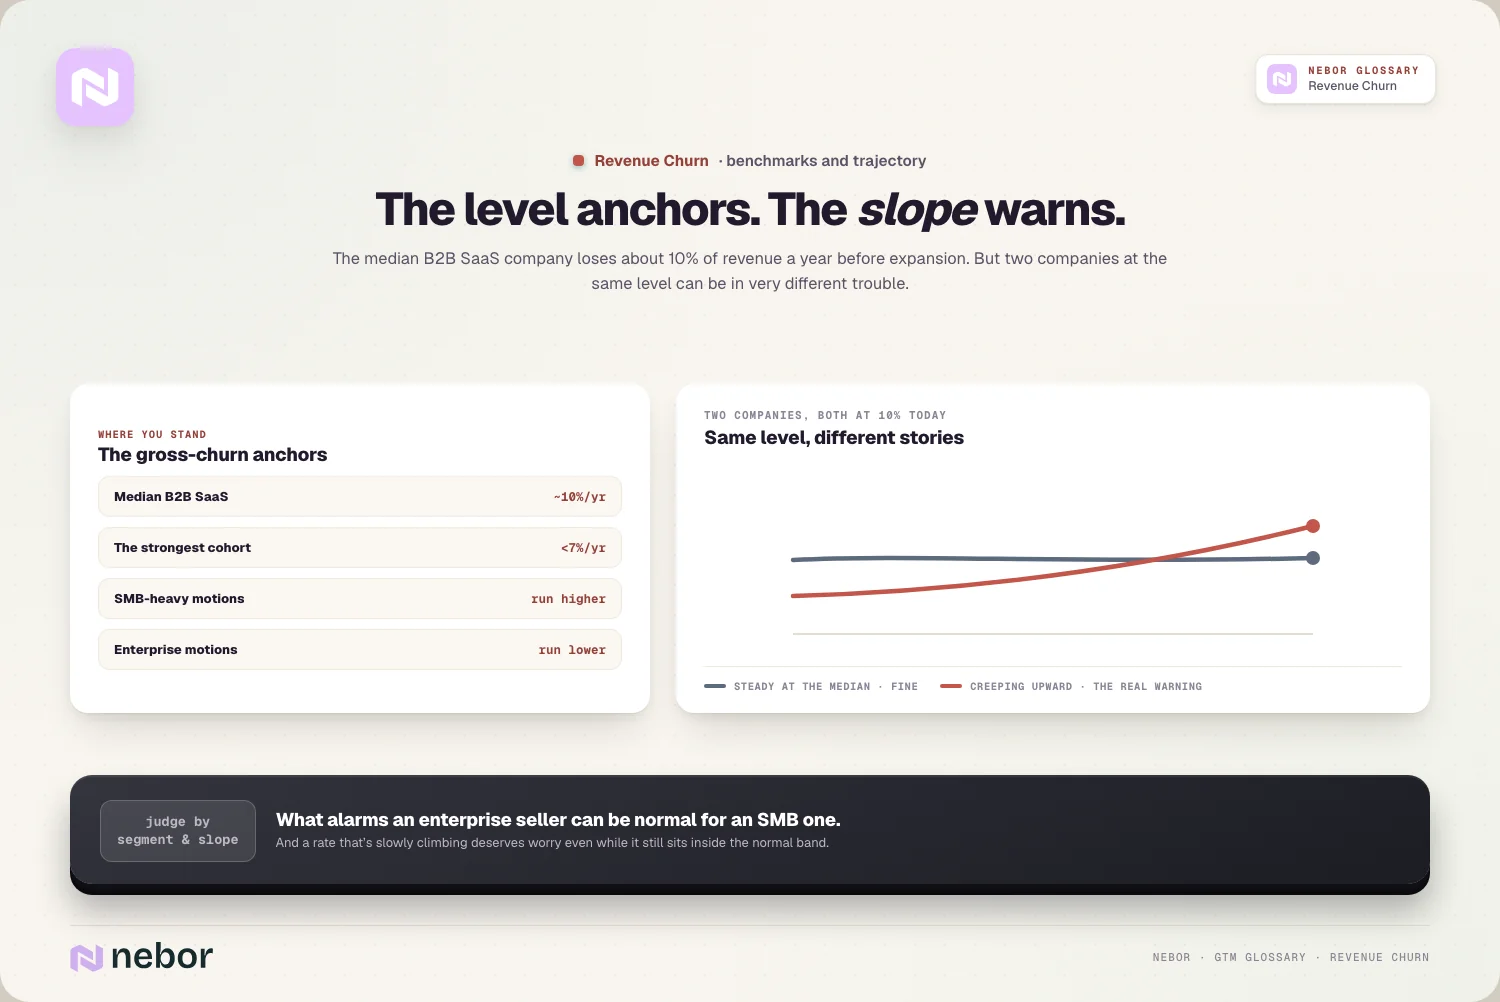
Segment shapes the number more than anything. Monthly churn lands higher for SMB and lower for enterprise, so a healthy revenue churn rate depends heavily on the market you serve.
So judge your revenue churn against your segment instead of a single universal figure. What's alarming for an enterprise seller can be normal for an SMB-focused one, because context shapes the bar.
Trajectory matters as much as the level. A revenue churn rate that's slowly climbing deserves attention even if it still falls within a normal band, because the direction often reveals a problem before the absolute number does.
Why revenue churn depends so heavily on the fit of your customers
A hard truth about revenue churn is that much of it is decided before a customer ever signs. Who you sell to shapes how much revenue leaks later.
Poor-fit customers churn the fastest here too. Customers who were never a strong match leave or downgrade quickly, dragging up revenue churn no matter how good your retention efforts are.
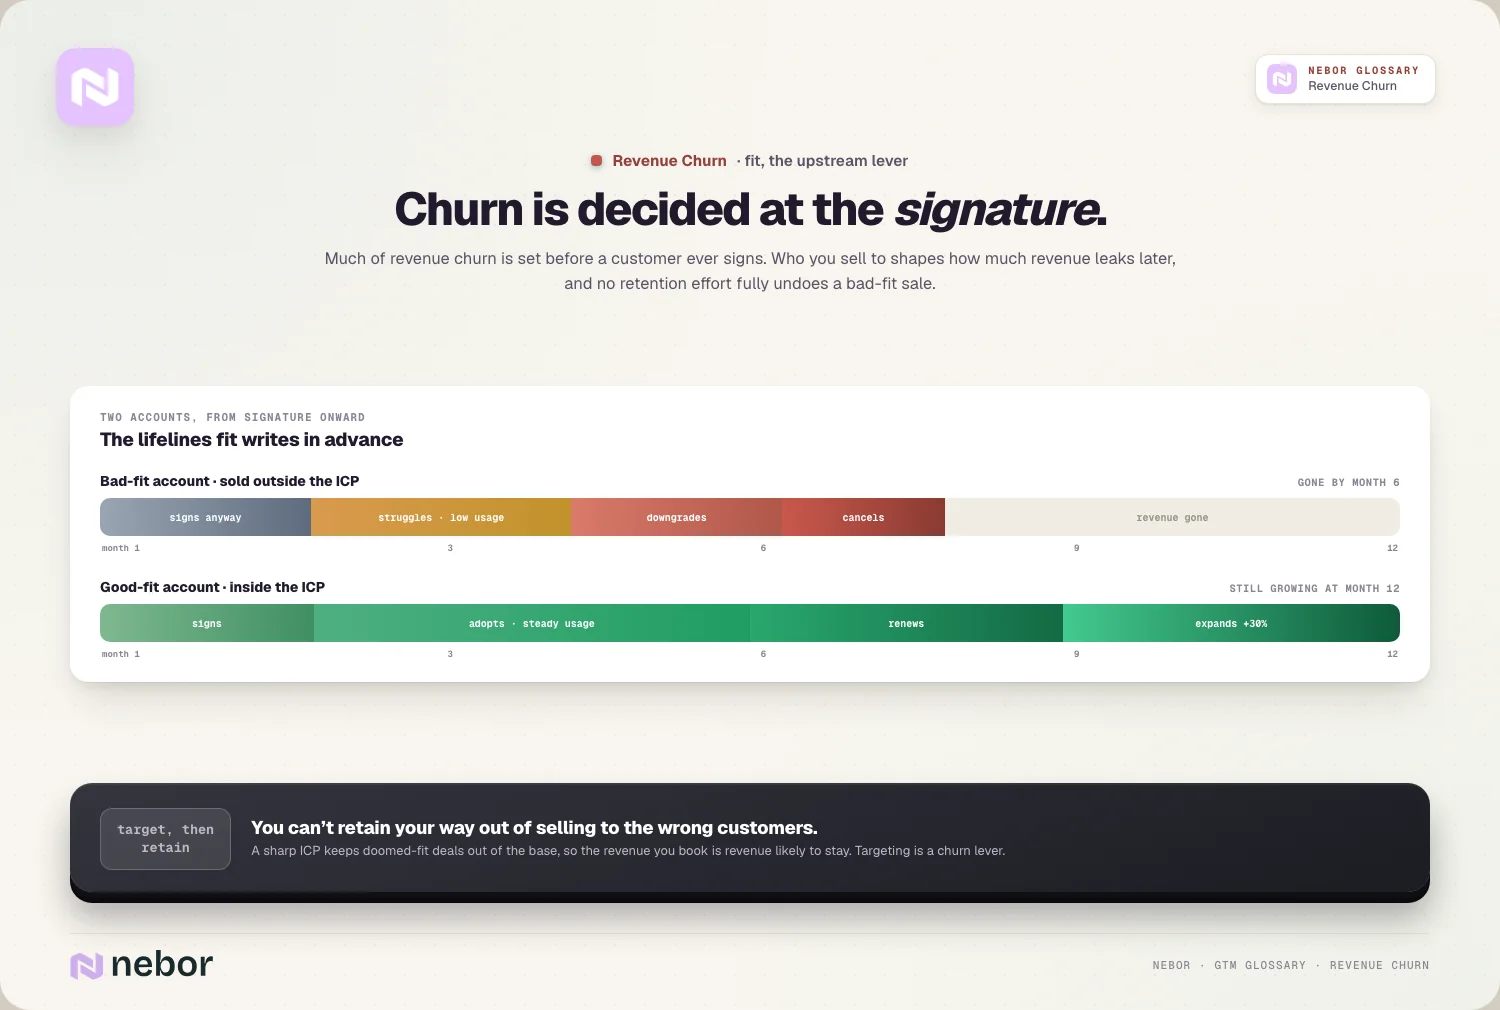
This traces straight back to your targeting. A sharp ideal customer profile keeps doomed-fit deals out of the base, so the revenue you book is revenue likely to stay.
Fit shows up directly in the dollars. Because bad-fit accounts often churn, selling to the wrong customers raises your revenue churn on top of costing you logos.
So strong revenue retention starts at the point of sale. You can't fully retain your way out of having sold to customers who were never going to stay, which makes targeting a real churn lever.
How revenue churn and customer churn tell a fuller story together
Neither churn metric is complete on its own, and reading them side by side reveals things either would hide, because the gap between them is where the insight lives. We tell clients to chart the two on the same axis for exactly this reason.
Similar numbers mean the losses are even. When revenue churn and customer churn track closely, you're losing accounts of roughly average size, so no particular tier is bleeding faster.
A gap between them points to a pattern. If revenue churn is higher than customer churn, your larger accounts are leaving, while the reverse means you're mostly losing small ones.
That pattern guides exactly where you act. Losing big accounts calls for attention to enterprise retention, while losing many small ones may point to an onboarding or fit problem lower down.
So the two metrics are most useful in combination. Revenue churn tells you the financial damage, customer churn tells you the count, and the gap between them tells you which customers you're really losing.
How to reduce revenue churn before it drains your revenue base
When revenue churn climbs high, a few levers bring it down, and they go beyond simply keeping customers. Preventing downgrades matters as much as preventing exits.
Onboarding to value comes ahead of everything. Customers who reach real value early stay, so getting them going fast directly reduces the churn that erodes your revenue base.
Watching account health catches the risk early. A cooling customer health score flags accounts drifting toward churn, so you can intervene before the revenue leaves.
Fighting downgrades protects the dollars as directly as fighting exits. Because revenue churn counts contraction, keeping customers on their plans matters as much as keeping them, which pure logo retention would ignore.
Growing your accounts offsets the losses too. Because net revenue churn nets out expansion, weighing fit properly at the point of sale, the heart of the fit score versus intent score distinction, keeps churn-prone accounts out of the base to begin with.
So reducing revenue churn means protecting both the customer and the contract. A retained account that downgrades still adds to revenue churn, so the dollar view changes what you focus on.
Why revenue churn is the center of the math behind your growth
Revenue churn shapes the fundamental economics of the business, going well past a retention stat, because it works against everything your growth engine builds.
It offsets your new sales dollar for dollar. Every dollar of revenue churn is a dollar your new business has to replace before you grow at all, so high churn turns acquisition into treading water.
It drags down lifetime value along the way. Because churn shortens how long revenue lasts, it directly lowers customer lifetime value and, in turn, worsens your LTV to CAC ratio.
It undermines the whole engine from underneath. A revenue engine with high churn leaks faster than it can fill, so growth stalls even when acquisition looks healthy.
So revenue churn works as a brake on growth well beyond a customer-success concern. Lowering it makes every other part of the business work harder for you, and that leverage is why leaders watch it so closely.
Small improvements compound meaningfully over the years. Because retained revenue keeps earning year after year, even a few points of lower revenue churn can add up to a large difference in where the business lands a few years out.
The common mistakes teams make when they read revenue churn wrong
Revenue churn gets misread in a few predictable ways, and we keep seeing the same ones in the metrics clients share with us, and avoiding them keeps the number honest.
The biggest is watching only customer churn. Tracking logos lost without tracking dollars lost can hide that your largest accounts are the ones leaving.
Another is confusing the gross and net versions. Reading a healthy net churn number while gross churn is high misses that expansion is masking real leakage underneath.
A third is ignoring the quieter downgrades. Focusing only on outright cancellations while customers shrink their spend understates true revenue churn.
The last is treating it as purely a retention job. Because much of revenue churn is set by fit at the point of sale, blaming only customer success misses the upstream cause.
Why revenue churn is often the number that tells you the truth
The deepest value of revenue churn is that it's hard to fool yourself with. Where customer counts can flatter you, dollars lost tell the real story of your base.
It reflects the financial reality more directly than logo counts. The business lives on revenue, so a metric measured in dollars maps directly to health in a way logo counts never can.
It exposes hidden weakness while there's time. A company losing its biggest accounts can look fine on customer churn while revenue churn reveals the danger.
It rewards an honest reading of both versions. Watching gross and net revenue churn together tells you both whether your base is leaking and whether expansion is covering it, which is the full truth.
That honesty is what makes revenue churn one of the most important health metrics in a modern go-to-market system. It tells you whether the revenue you work to win, even as you automate sales prospecting to fill the top of the funnel, is staying once you've earned it.
Share this post
RevOps
Glossary
Related glossary items
Understanding the core GTM concepts




Ready to build your pipeline